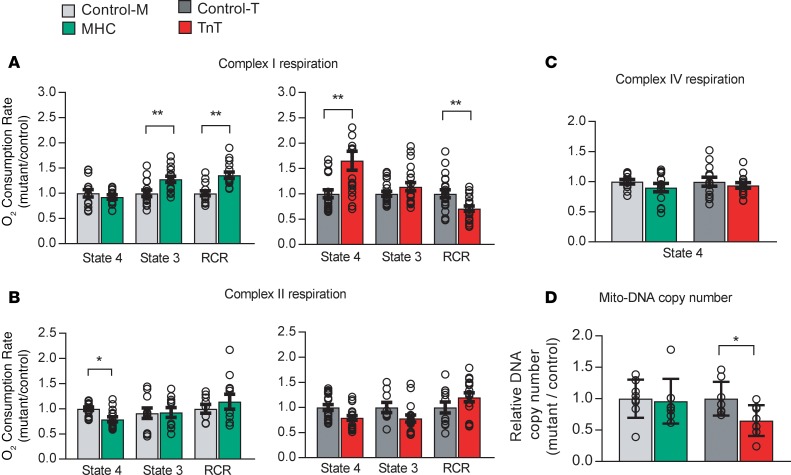
Figure 9. Mitochondrial studies.
Respirometry: Mitochondria were freshly isolated from mutant and littermate control hearts, in parallel. An XF96 analyzer was used to measure function of complexes I, II, and IV at 37°C. Oxygen consumption rate (OCR) was measured in state 4 (no ADP) and/or state 3 (with 1 mM ADP) using substrates for the electron transport chain (ETC) complex I (5 mM glutamate/malate), complex II (5 mM succinate, in the presence of rotenone, an ETC-complex I inhibitor), and complex IV (0.5 mM TMPD [N,N,N′,N′-tetramethyl-p-phenylenediamine]). Coupling of O2 consumption to ADP phosphorylation was estimated by computing the respiratory control ratio (RCR; state 3/state 4 respiration). (A) Complex I respiration: MyHC mutants had higher state 3 respiration and higher RCR, whereas TnT mutants had higher state 4 respiration and lower RCR, when compared with respective littermate controls. (B) Complex II respiration: MyHC mutants had lower state 4 respiration, but complex II RCR of MyHC mutants was similar to that of controls. No difference was noted between TnT mutants/controls. (C) Complex IV respiration in both mutants was similar to respective littermate controls. Data are presented as mean ± SEM. n = 15 experiments from 5 mitochondrial preparations/10 mice in each group for control-M/MyHC, and n = 21 experiments from 7 mitochondrial preparations/14 mice in each group for control-T/TnT. *P < 0.05, **P < 0.001, using 2-sided unpaired Student’s t test and Bonferroni’s correction for multiple testing. (D) Mitochondrial number: Total DNA was isolated from whole hearts for qRT-PCR of COX-1 (mitochondrial gene) and GAPDH (nuclear gene). Mitochondrial DNA (Mito-DNA) copy number is presented as relative copy number of COX-I/GAPDH. Copy numbers in each mutant were normalized to copy numbers in respective littermate controls. MyHC hearts had similar mitochondrial DNA copy number, whereas TnT mutants had lower mitochondrial DNA copy number, when compared with respective littermate controls. Data are presented as mean ± SD. n = 8 hearts in each group. *P < 0.05, **P < 0.01, using 2-sided unpaired Student’s t test.

