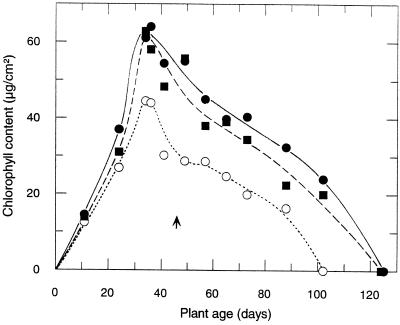
Figure 5.
Mean chlorophyll content during the course of leaf maturation and senescence of wild-type (○), Dara-5 (▪), and Dara-12 (•) potato plants. The arrow indicates onset of flowering, which was at about the same time for all lines. Day 1 was October 26, 1997. Each point represents the mean chlorophyll content of 10 segments cut (two were taken at d 11) in regular distances from leaflets of apical to basal leaves. Data from two representative plants per line are depicted. Because of the sampling, aging was slightly (about 3 weeks) accelerated in all plants.

