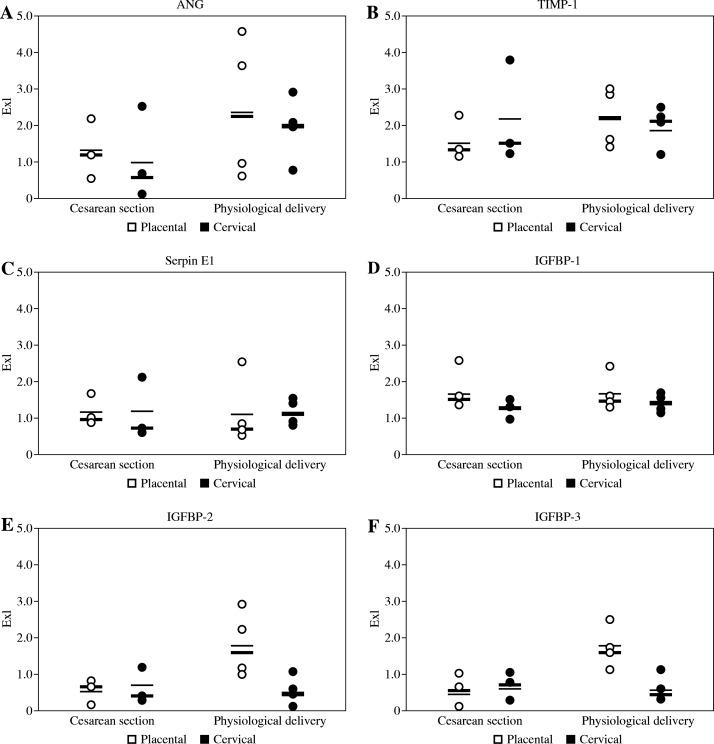
Fig. 1.
The concentration of ANG, TIMP-1, Serpin E1, and IGFBP1-3 in amniotic membrane extracts expressed in units of optical density (Exl). Each dot represents the result of respective measurement in one individual amnion sample, white dots represent placental portions of each membrane, whereas black dots represent cervical portions of each membrane. Mean values of ANG, TIMP-1, Serpin E1, and IGFBP1-3 concentration in each group are indicated as dashed lines, the median values are shown as solid lines

