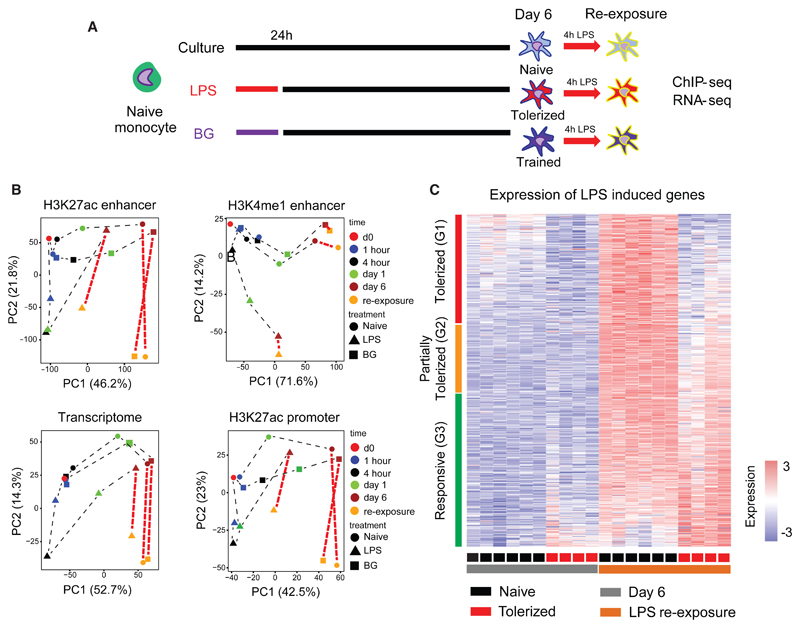
Figure 3. Macrophage Endotoxin Tolerance Defined at the Transcriptional Level following LPS Re-exposure.
(A) The innate immune memory model, including data collection at LPS re-exposure at day 6.
(B) PCA plots of dynamic RNA-seq, H3K27ac at promoters and enhancers, and H3K4me1 peaks, including LPS re-exposure samples. After re-exposure to LPS, significant enhancer H3K27ac changes occur in LPS-Mfs, indicating that they are capable of activating their enhancers. However, the level of their response is lower compared to monocytes, naive-Mfs, and BG-Mfs, which can be seen on the second principal component. Unlike RNA and H3K27ac, H3K4me1 does not show significant changes following LPS re-exposure in any of the three macrophage subtypes.
(C) The total macrophage transcriptional response (750 genes) to LPS was separated into three groups based on the induction of genes in LPS-Mfs, relative to naive-Mfs and BG-Mfs, revealing a gradient in LPS-Mf response to LPS re-exposure. The groups are (G1) tolerized genes, (G2) partially tolerized genes, and (G3) responsive genes.
See also Figure S5.

