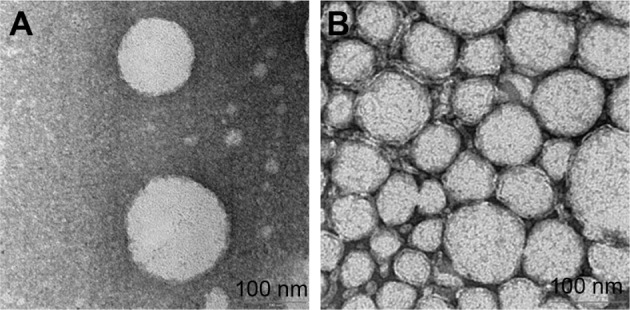
Figure 4.

TEM photomicrographs of cefuroxime-loaded nanoemulsion after negative staining with uranyl acetate.
Notes: (A) The image of oil droplet after 100× dilution. (B) The image of oil droplet after 50× dilution. The scale bars represent 100 nm.
Abbreviation: TEM, transmission electron microscope.
