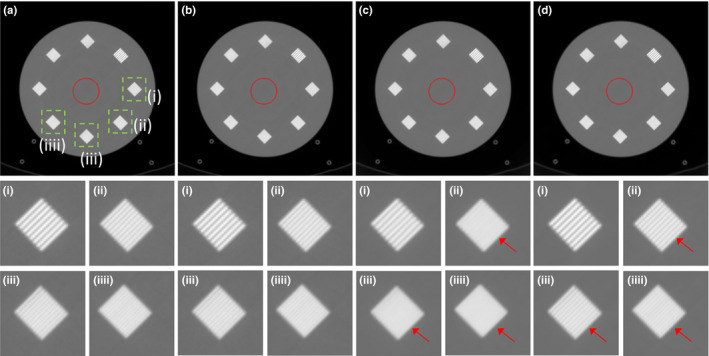
Figure 5.

The reconstructed images of the ACR phantom using (a) regular dose FBP, (b) quarter dose FBP, (c) TV and (d) the proposed method. High‐contrast resolution patterns from (i) to (iiii) in the same square (1.5 mm2) were compared. Window level was [‐1000, 1300] HU and standard deviations in red circle were (a) 6.5, (b) 8.1, (c) 5.9, and (d) 6.1 HU.
