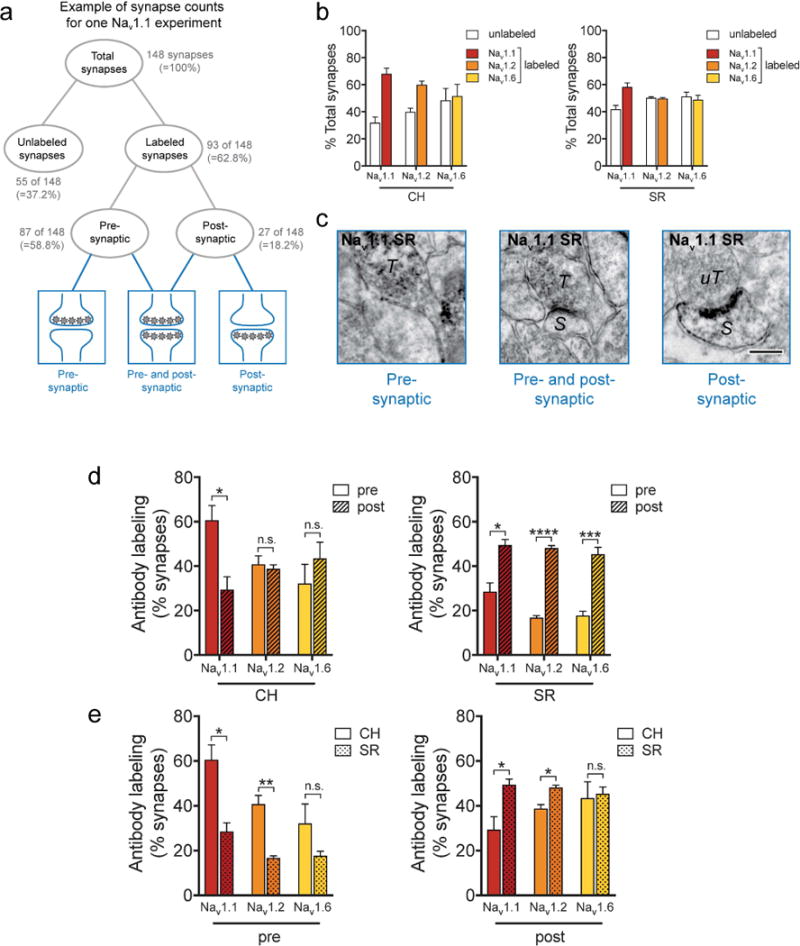
Figure 6.

Synapses in the DG central hilus (CH) express more Nav 1.1 in axon terminals and synapses in the CA1 stratum radiatum (SR) express more Nav 1.1 and Nav 1.2 in dendrites and spines. A. Schematic diagram showing example of data quantification. All labeled and unlabeled synapses were identified (A, top; B). Labeled synapses were further categorized as pre- (C, left), post- (C, right), or pre-and postsynaptic (C, middle) labeling (A, bottom; C). Bar graphs show labeling in pre- or post-synaptic compartments divided by total number of synapses (B, D, E); unlabeled synapses made up 30-50% of total synapses (B). C. Nav 1.1 immunoreactive axon terminal (T) next to an unlabeled postsynaptic compartment in the SR (left). A Nav 1.1 immunoreactive axon terminal (T) synapses with labeled spine (S) in the SR (middle). A Nav 1.2 immunoreactive spine (S) synapses with an unlabeled axon terminal (uT) in the SR (right). Bar 250 nm. D. Quantitative analysis shows that Nav 1.1 immunoreactivity is significantly more presynaptic in the CH (left), whereas all Nav 1 subtypes are significantly more postsynaptic in the SR (right). Data were analyzed from 15 micrographs obtained from three rats per experimental group; n = 352 to 398 profiles in CH and 654 to 698 profiles in SR. E. Quantitative analysis showing axon terminals in the CH express more Nav 1.1 and Nav 1.2 labeling compared to axon terminals in the SR, and that dendrites and spines in the CH express less Nav 1.1 and Nav 1.2 labeling compared to dendrites and spines in the SR. Data were analyzed from 15 micrographs obtained from three rats per experimental group; n = 110 to 167 profiles in presynaptic compartments and 98 to 352 profiles in postsynaptic compartments. * p<0.05, ** p<0.01, *** p<0.001, **** p<0.0001, n.s.-not significant.
