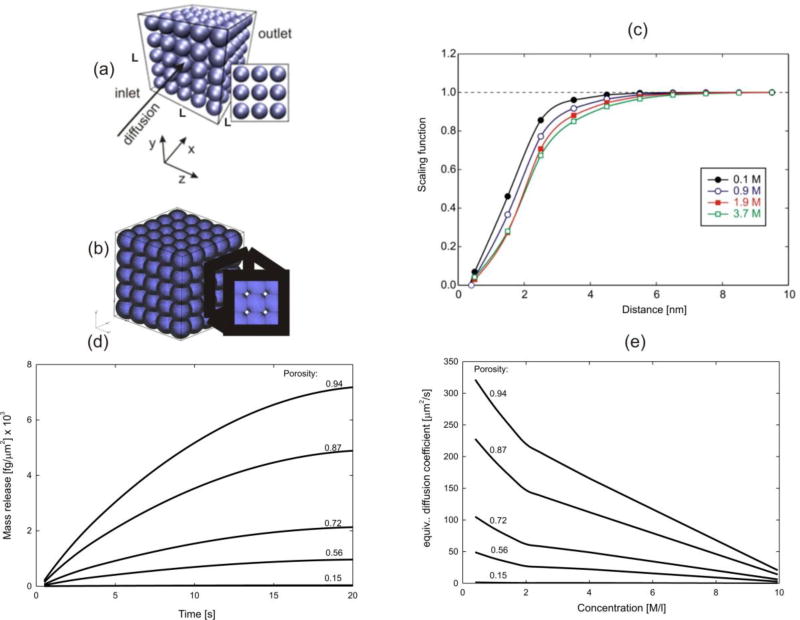
Fig. 2.
Mass release curve for diffusion of glucose molecules through porous medium with silica spheres as solids [47]. (a) Larger porosity. (b) Small porosity of 15% and complex geometry of pores. (c) Scaling functions for glucose-silica interaction; diffusion coefficient is D(h,c)=f Dbulk, where h is distance from solid surface and f is the scaling function. (d) Mass release curves for several porosities. (e) Equivalent diffusion coefficient in terms of concentration. Model size: 125,000 3D finite elements, 132,651 nodes.

