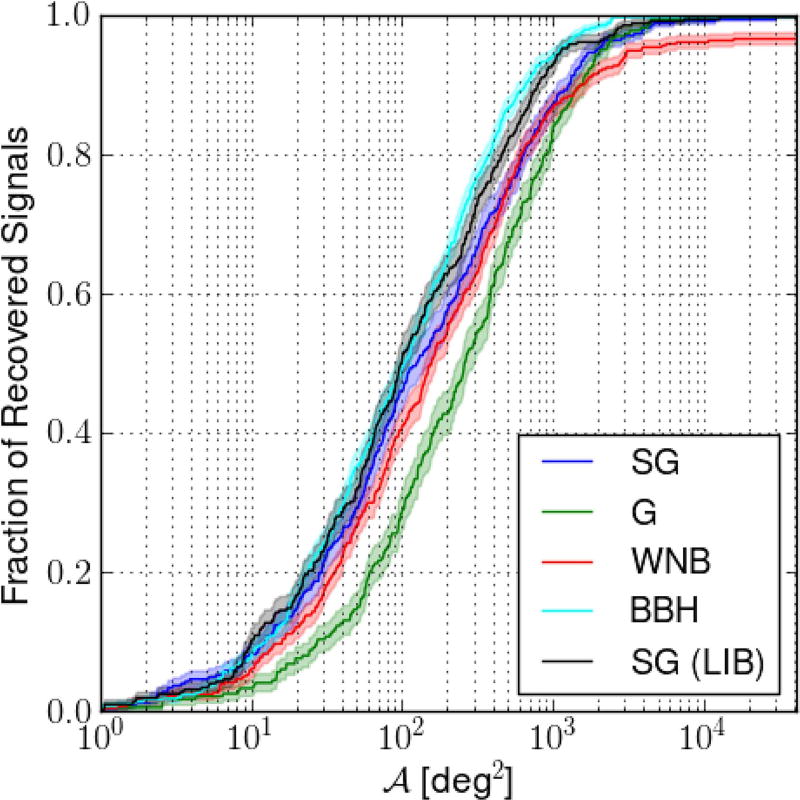
Figure 2.
Cumulative histograms of the searched area (𝒜). Histograms for different morphologies follow a similar trend, except that the curves are shifted along the horizontal axis. A reference curve labeled with SG (LIB) shows results for the LIB pipeline on the subset of SG signals identified as signals by BW. The complete figure set (three figures) showing the same plot for cWB and LIB pipelines is available in the online journal.
(The complete figure set (3 images) is available.)

