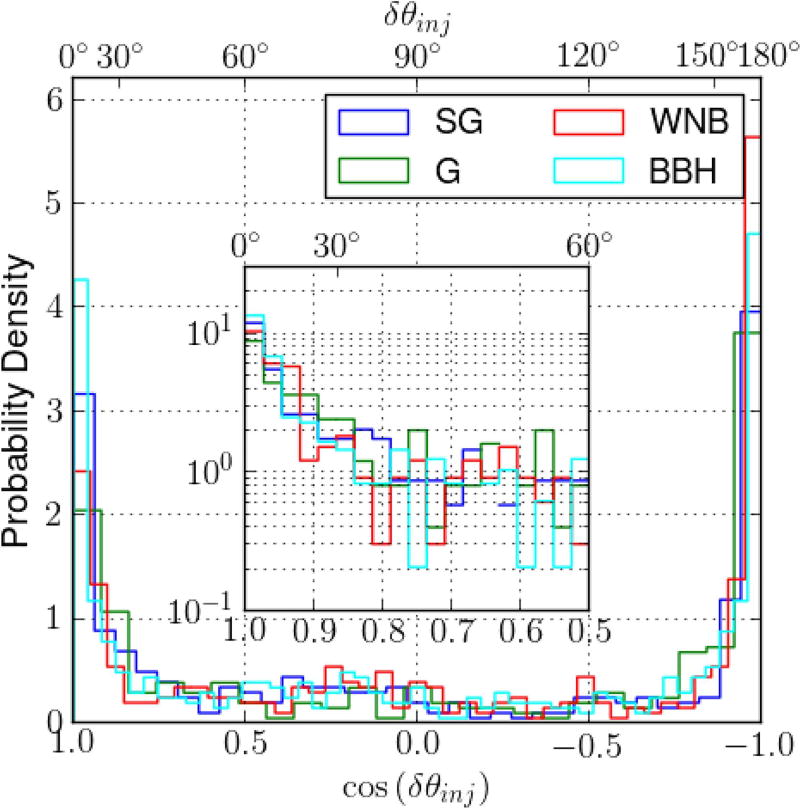
Figure 3.
Normailzed histograms of the extent (δθinj) of skymaps for the four different injection morphologies. The distributions are bimodal for all morphologies with peaks at cos(δθinj) = ±1. The complete figure set (three figures) showing the same plot for cWB and LIB pipelines is available in the online journal.
(The complete figure set (3 images) is available.)

