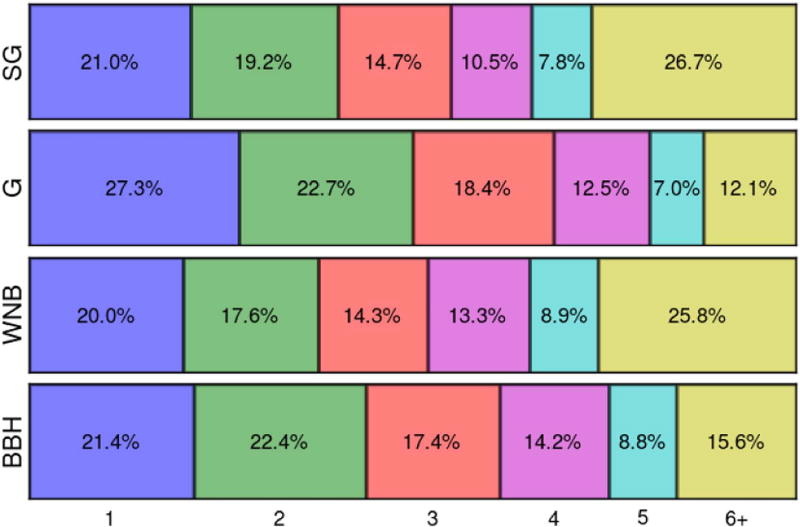
Figure 4.
Distributions of fragmentation. Each row corresponds to one of the four morphologies (SG, G, WNB, and BBH). Numbers at the bottom of the chart represent the number of disjoint regions in parts of the sky where psky ≥ p0. The number of disjoint regions is smaller than 4 for more than 50% of injected signals for all morphologies. The complete figure set (three figures) showing the same plot for cWB and LIB pipelines is available in the online journal.
(The complete figure set (3 images) is available.)

