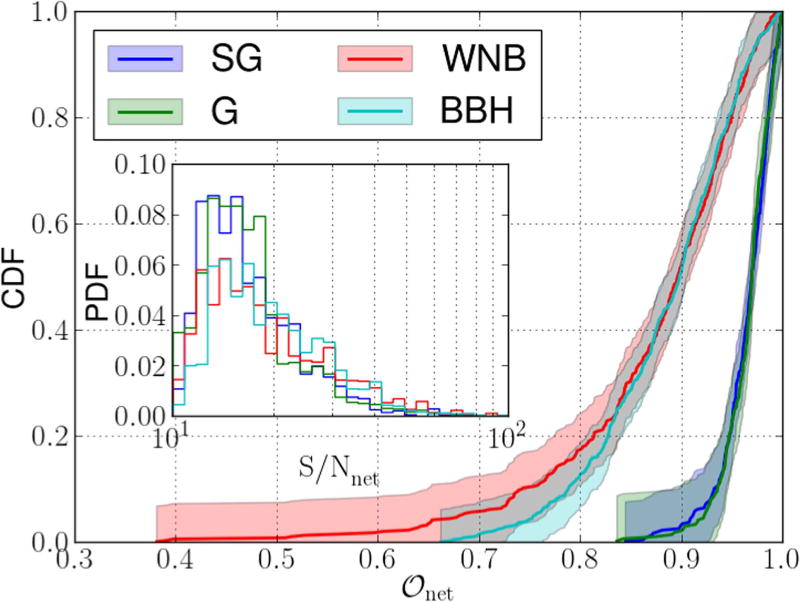
Figure 5.
Cumulative distribution function (CDF) of network overlaps (𝒪net). Shadings represent the 2σ uncertainties calculated using the Dvoretzky-Kiefer– Wolfowitz inequality (Dvoretzky et al. 1956). The lower the curves reach at a given 𝒪net value, the better the reconstruction. The inset shows the normalized histogram of the network signal-to-noise ratio (S/Nnet) for signals with four different morphologies. The curves for SG and G signals are identical within the 2σ statistical errors, and they indicate significantly better reconstructions of SG and G signals than of WNB and BBH signals.

