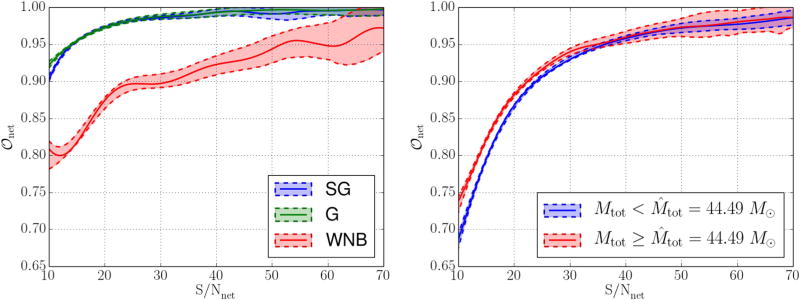
Figure 6.
Dependence of network overlaps (𝒪net) on network signal-to-noise ratios (S/Nnet) for SG, G, WNB, and BBH signals. Note that we excluded the injections with S/Nnet > 100 from the curve estimation. Shaded areas represent the 1σ uncertainty regions of the measured 𝒪net values. The left panel shows the S/Nnet dependence of 𝒪net for SG, G, and WNB signals. All three morphologies show a clear trend of increasing overlap with increasing S/Nnet. The right panel shows the S/Nnet dependence of network overlaps for BBH signals with a detector-frame total mass below and above the median total mass M̂tot = 44.49 M⊙. BW performed significantly better for signals with higher Mtot at S/Nnet ≲ 35 values.

