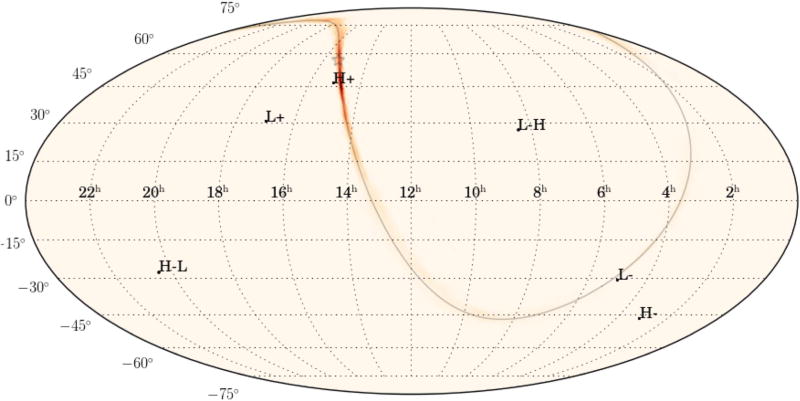
Figure 9.
Example skymap showing the reconstructed sky location for an injected SG signal. The injected location is marked with a star, and the corresponding triangulation ring for L1 and H1 detectors is denoted with a gray line. H–L and L–H marks the direction between the two detectors, H+ and L+ the directions above the detectors, and H- and L- the directions below the detectors. The complete figure set (20 figures) showing 5 example skymaps for each morphology is available in the online journal. Skymaps for all the signals used in this study are available in the Burst First2Years sky localization Open Data release (http://www.ligo.org/scientists/burst-first2years/).
(The complete figure set (20 images) is available.)

