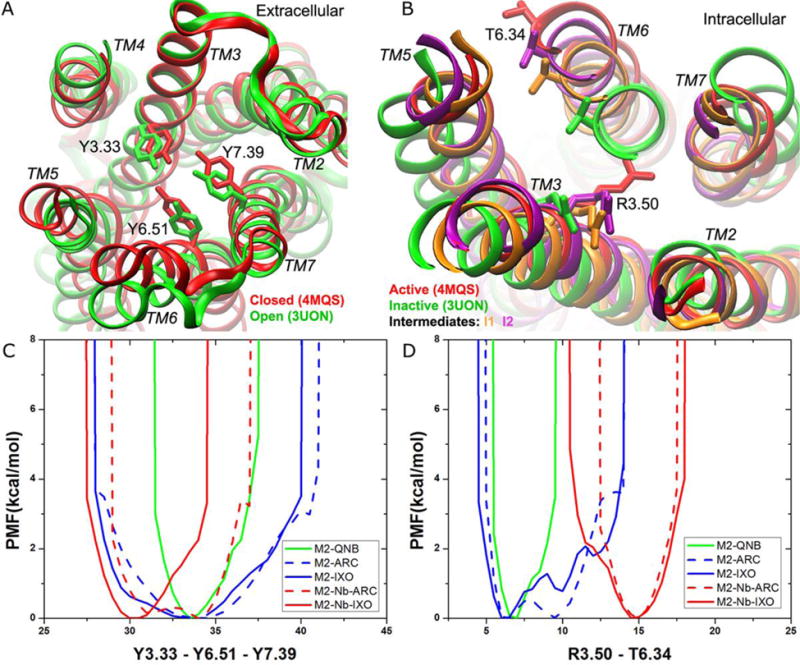
Figure 4.

GaMD simulations revealed distinct low-energy states of the M2 muscarinic GPCR in the orthosteric ligand-binding and intracellular G protein coupling sites: (A) The orthosteric site exhibits closed (red, 4MQS X-ray) and open (green, 3UON X-ray) conformations. (B) The G protein coupling site samples inactive (green, 3UON X-ray), intermediates “I1” (orange), “I2” (purple) and active (red, 4MQS X-ray) conformational states. (C-D) The 1D PMF profiles of (C) the Tyr1043.33−Tyr4036.51−Tyr4267.39 triangle perimeter and (D) the Arg1213.50−Thr3866.34 distance calculated for the M2-QNB, M2-ARC, M2-IXO, M2-nanobody-ARC and M2-nanobody-IXO complex systems.
