
Figure 8.
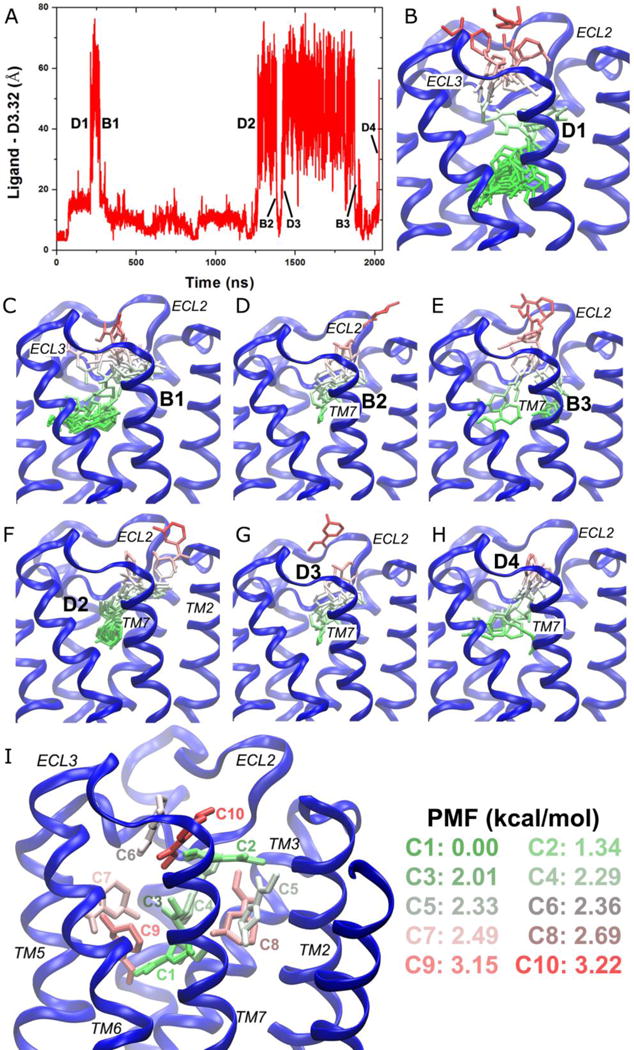
GaMD simulations revealed pathways of dissociation and binding of the arecoline (ARC) partial agonist of the M2 muscarinic GPCR: (A) Timecourse of the ARC−Asp1033.32 distance during 2030 ns GaMD simulation. Four dissociation and three binding events are labeled. (B-H) Schematic representations of the ligand pathways during (B) “D1”, (C) “B1”, (D) “B2”, (E) “B3”, (F) “D2”, (G) “D3” and (H) “D4”. The receptor is represented by blue ribbons and the ligand by sticks colored by the position along the membrane normal. (I) Ten lowest energy structural clusters of ARC that are labeled and colored in a GWR scale according to the PMF values.