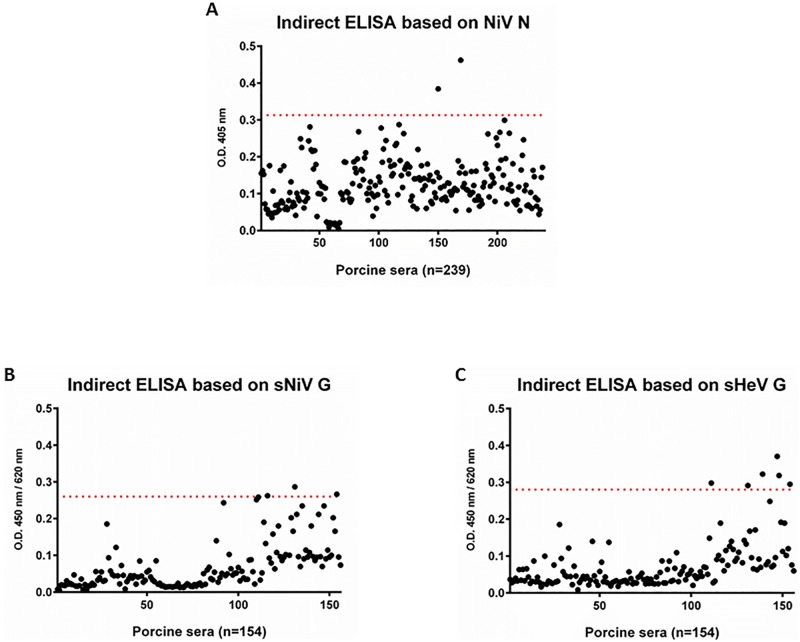
Fig 3. Cut-off determination for the three independent ELISAs.
Cut-off values were evaluated by testing of 239 negative control sera (NiV N based ELISA) and 154 sera (sHeV and sNiV G based ELISAs). The horizontal red broken line represents the cut-off value defined as mean OD value of all tested negative control sera plus three standard deviations. OD values were measured at 450 nm for the sHeV G and sNiV G as well as at 405 nm for the NiV N based ELISAs.

