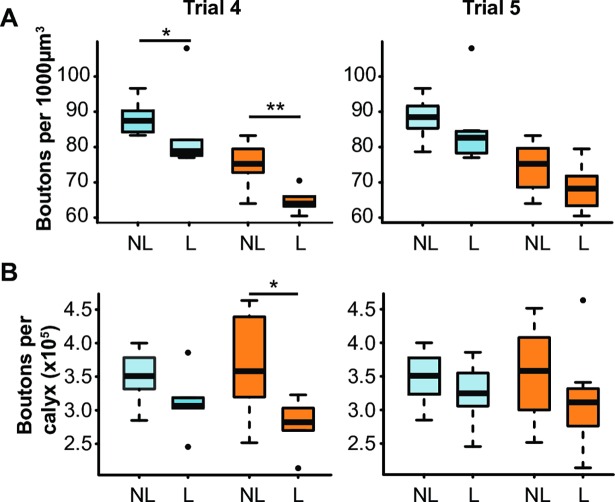
Fig 6. Synaptic bouton density and number and reversal learning performance.
Boxplots showing the characteristics of the dense collar (blue) and lip (orange) of non-learners (NL, IS = -1 or 0) and learners (L, IS = 1) for each of the last two trials of the reversal phase: (A) density of synaptic boutons, (B) number of synaptic boutons per neuropil. [Trial 4: n = 12 NL and 6 L; Trial 5: n = 10 NL and 8 L] * p < 0.05, ** p < 0.005, Mann-Whitney U-Test.

