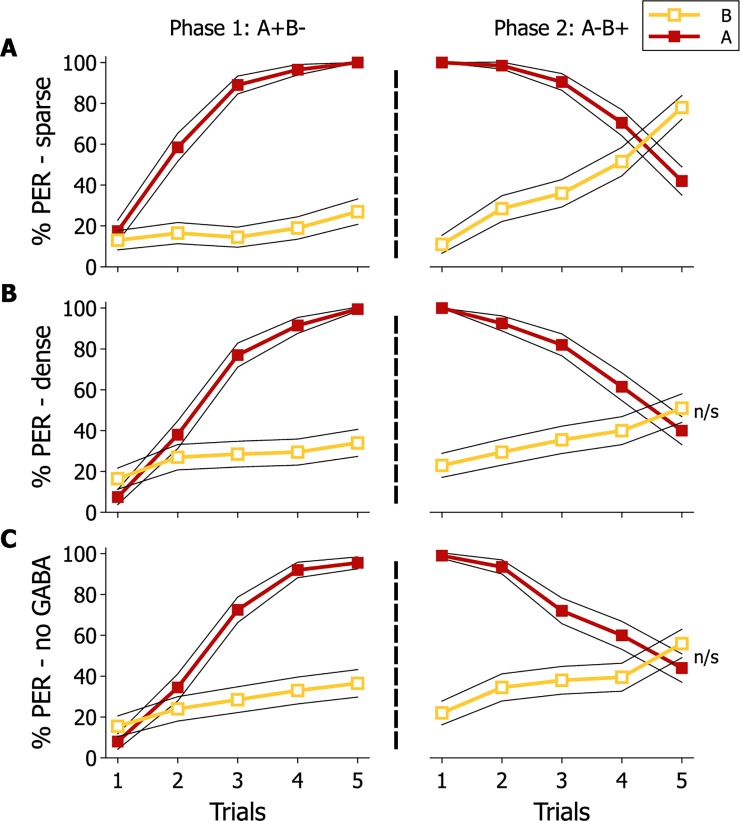
Fig 7. Modelled consequences of varying MB connectivity on reversal learning performance.
Modelled percentage of individuals displaying PER in response to odours A (red line) and B (orange line) during the reversal learning paradigm. Three different models were run simulating a sparse (A) or dense (B) distribution of excitatory connections onto MB neurons (KC), and (C) sparse with suppressed inhibitory input from the GABAergic PCT. 200 agents (virtual bees) were modelled for each model configuration. The 95% confidence intervals are represented by the black lines.

