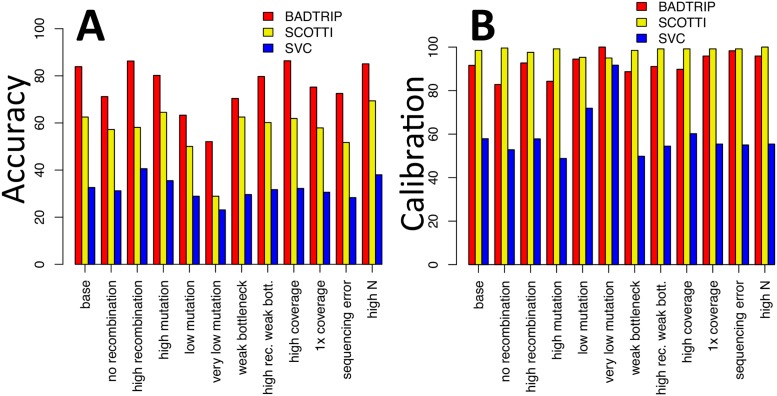
Fig 3. Accuracy and calibration of BadTrIP on simulated data.
A) We represent accuracy as the frequency with which the correct simulated transmission event is more likely a posteriori than the alternatives. B) Calibration is the frequency with which the correct transmission event is in the 95% posterior credible set (the minimum set of sources with cumulative probability ≥ 95% such that all sources in the set have higher posterior probability than all sources outside of it). Bars represent percentages (from 0, worst, to 100, best) for BadTrIP (red), SCOTTI [13] (yellow) and the shared variants-based clustering (SVC) approach [30] (blue). On the x axis are different simulation scenarios with the first one, “base”, being the basic simulation scenario with 10–15 cases per outbreak, about 300–500 SNPs among all hosts, recombination 10 times stronger than mutation, complete bottleneck (no transmission of within-host genetic variants), read coverage of 40x, PoMo virtual population size of 15, actual pathogen population size of 1000, and genome size of 5 kb. All other scenarios are obtained from the base one changing one or two parameters: in “no recombination” the recombination rate is set to 0; in “high recombination” the recombination rate is 10 times higher; in “high mutation” the mutation rate is 10 times higher resulting in 2000–3000 SNPs per outbreak; in “low mutation” the mutation rate is 10 times lower resulting in 30–50 SNPs per outbreak; in “very low mutation” the mutation rate is 1000 times lower, resulting in 0–1 SNPs per outbreak; in “weak bottleneck” at transmission 5 pathogen units from the infector colonised the infected host, instead of just 1; in “high rec. weak bott.” both the recombination rate is 10 times higher and the founding population at transmission is made of 5 pathogen particles; in “high coverage” read coverage in sequencing is 100x instead of 40x; in “1x coverage” read coverage in sequencing is 1x instead of 40x; in “sequencing error” 0.2% of read bases are randomly modified to simulate sequencing error, coverage is reduced to 20x, and genome size is reduced to 1kb; in “high N” the PoMo virtual population size is 25 instead of 15.

