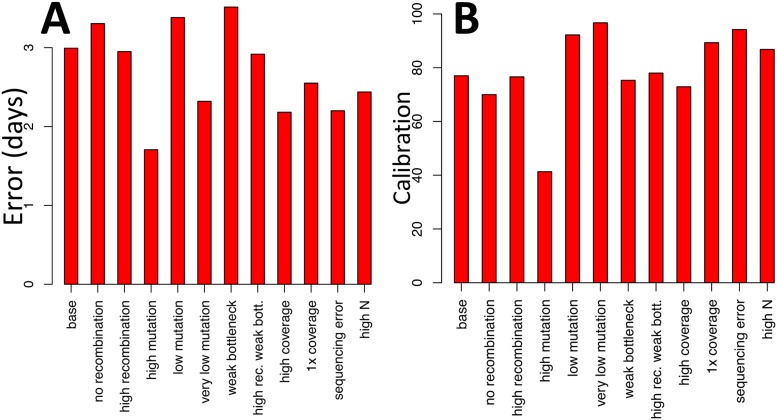
Fig 4. Error and calibration of BadTrIP inferring infection time from simulated data.
A) Error (root mean square error) of the inferred median times of infection with BadTrIP. The time unit is days, with a simulated transmission rate of 0.1 per day, and a recovery rate of 0.07 per day (mean duration of infection ≈ 14.3 days). B) Calibration (the percentage with which the true time of infection is within the inferred 95% credible interval) for the time of infection with BadTrIP. Simulation scenarios are as in Fig 3.

