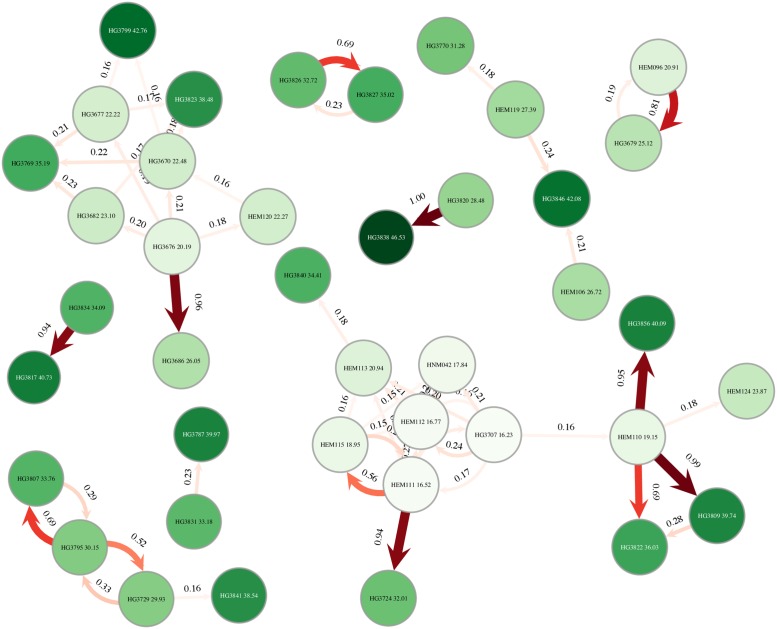
Fig 5. Inference of transmission in the early 2014 Ebola outbreak in Sierra Leone.
A) Transmission events with posterior probability higher than 15% as inferred by BadTrIP. Circles represent hosts, while arrows are transmission events between hosts. Only hosts connected to any other host are represented. The numbers next to arrows represent their posterior probability (between 0.0 and 1.0), as does their shade of red (from pale to dark red) and arrow thickness. Numbers within circles represent the inferred (posterior median) time of infection of the respective host, as also does the shade of green (from pale to dark green) of the circle. Time is expressed in days from the date of the first availability of the first host.

