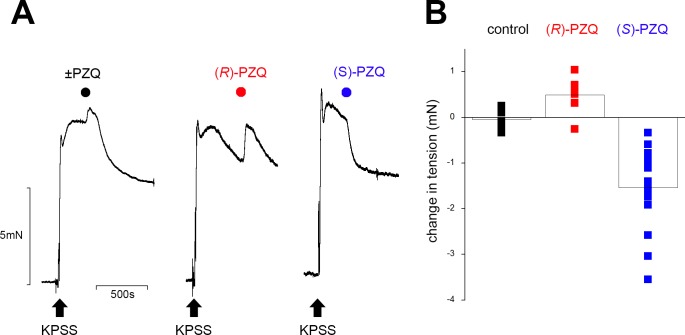
Fig 2. (S)-PZQ decrease tone of contracted mesenteric arteries.
(A) Representative tension recordings showing addition of ±PZQ (left), (R)-PZQ (50μM, middle) and (S)-PZQ (50μM, right) during a KPSS-evoked contraction. (B) Individual data points (squares) show magnitude of tension change measured at a fixed time interval (1 min) after addition of (R)-PZQ (red) or (S)-PZQ (blue) relative to control traces (DMSO, vehicle) during a KPSS-evoked contraction. Each data point represents a single measurement from a unique vessel (n≥6 measurements for each condition). Average of all measurements represented by the bar chart.

