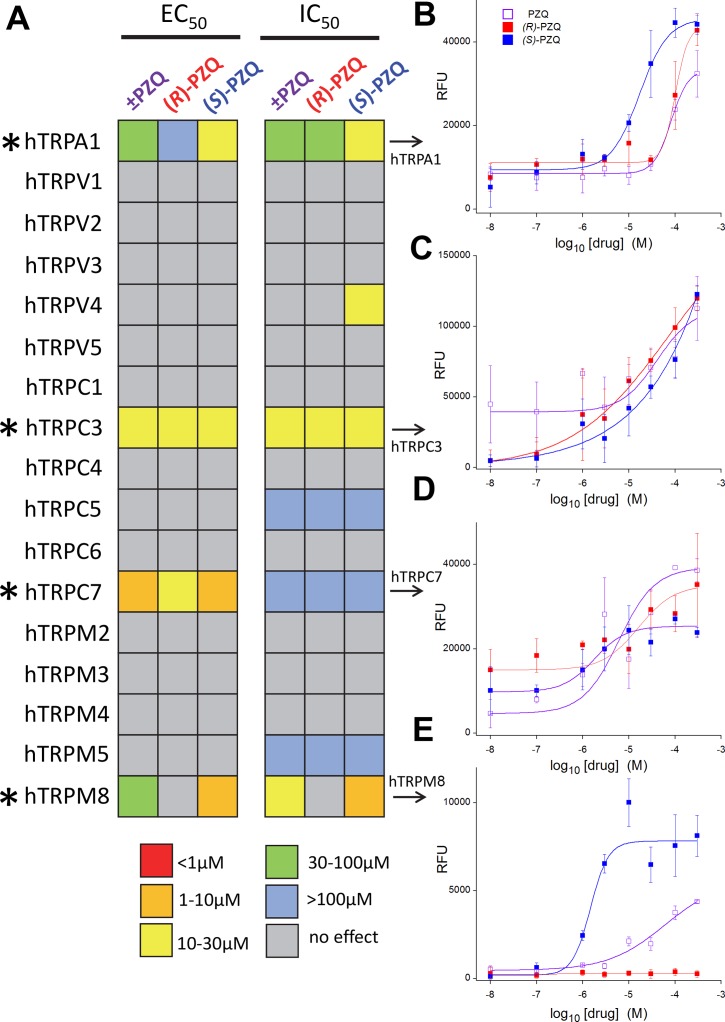
Fig 3. Interrogating a TRP channel panel for praziquantel activity.
(A) Graphical schematic of results from primary screen measuring activation (EC50, left) or inhibition (IC50, right) of 17 individual human TRP channels to ±PZQ, (R)-PZQ and (S)-PZQ. EC50 and IC50 values are color encoded as per legend key, where increasing warm coloration represents higher resolved potency in assays. Responsive hTRPs are identified with asterisks (*). (B-E) Individual dose-response curves for activation of (B) hTRPA1, (C) hTRPC3, (D) hTRPC7 and (E) hTRPM8 by ±PZQ (open purple squares), (R)-PZQ (red squares) and (S)-PZQ (blue squares).

