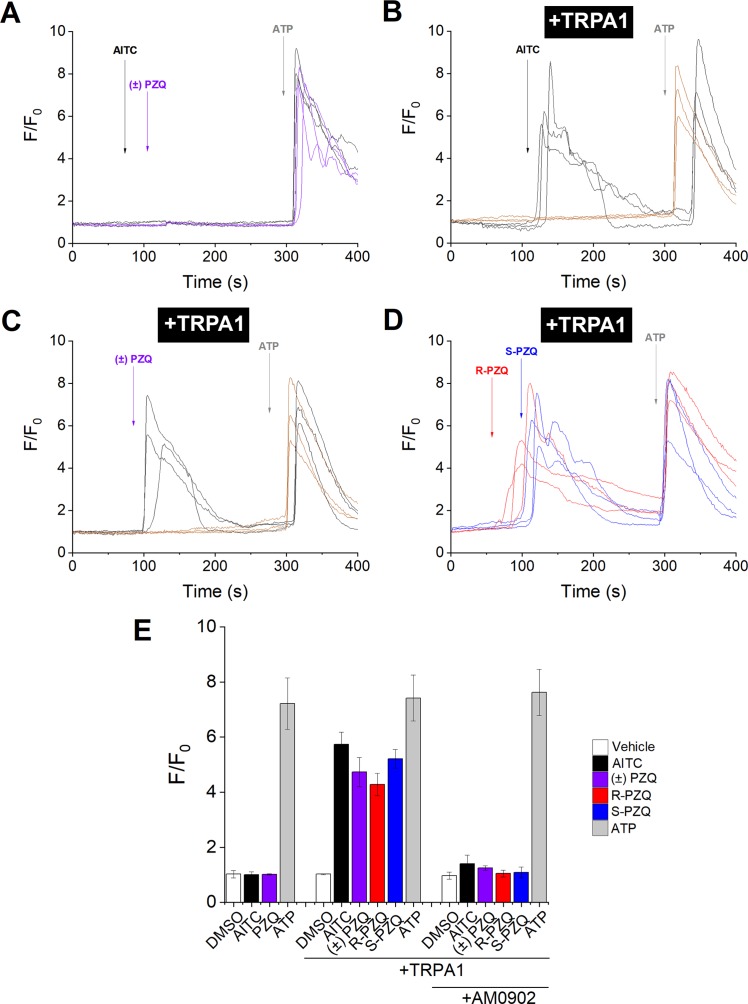
Fig 6. PZQ enantiomers activate TRPA1.
(A) Representative fluorescence traces from HEK293 cells loaded with Fluo-4 AM following the addition of AITC (100μM, black) or ±PZQ (100μM, purple), followed by addition of ATP (100μM). (B) Representative fluorescence traces from HEK293 cells transfected with hTRPA1 and loaded with Fluo-4 AM following the addition of AITC (100μM), followed by addition of ATP (100μM), in the presence of DMSO (0.1%, black) or AM-0902 (1μM, brown). (C) Representative fluorescence traces of HEK293 cells transfected with hTRPA1 and loaded with Fluo-4 AM following the addition of ±PZQ (100μM), followed by ATP (100μM), in the presence of DMSO (0.1%, black), or AM-0902 (1μM, brown). (D) Representative fluorescence traces from HEK293 cells transfected with hTRPA1 and loaded with Fluo-4 AM following the addition of R-PZQ (100μM, red) or S-PZQ (100μM, blue), followed by addition of ATP (100μM). (E) Cumulative measurements of peak fluorescence ratio (F/F0, where ‘F’ represents fluorescence at peak and ‘F0’ represents fluorescence at time = 0) from Ca2+ imaging experiments under indicated conditions. Data represent representing population mean±s.e.m. (>20 cells) from n≥3.

