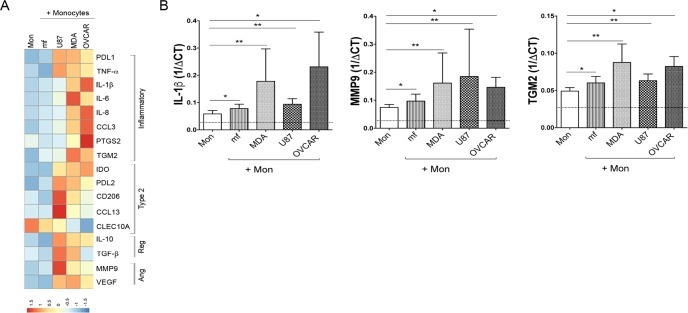
Fig 1. mRNA expression of selected genes associated with inflammation, type 2, regulatory, and angiogenesis.
Human monocytes were either unexposed (Mon) or exposed to CMFDA-labeled three different cancer cell lines (MDA, OVCAR, U87), or to live mf of Brugia malayi for 48 hours. CD45+/CMFDA- monocytes were sorted and mRNA levels were measured by TaqMan real-time PCR and normalized to the levels of 18S rRNA. A) Heat map of differential expression of selected inflammatory, type-2, regulatory (Reg) and angiogenesis (Ang) related genes (geometric means of 1/delta CT; n = 10). The intensity of blue to red denotes the low to high expression of genes respectively. B) mRNA expression of IL-1β, MMP-9 and TGM2. The data are expressed as the geometric mean with 95% confidence interval of 1/delta CT (n = 10). * P<0.05, ** P<0.005.

