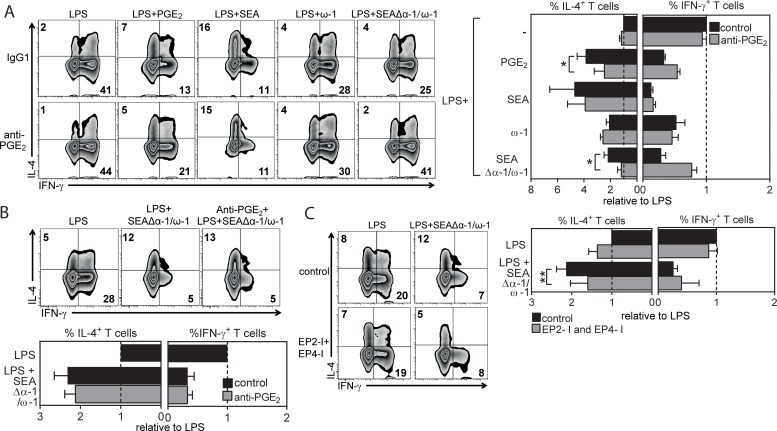
Fig 2. ω-1–independent Th2 polarization by SEA is dependent on PGE2 synthesis by moDCs.
(A–C) T-cell polarization assay as described in Fig 1B. (A) Neutralizing anti-PGE2 antibody was added during stimulation of moDCs with indicated reagents or (B) during DC–T cell coculture. (C) EP2 and EP4 receptor inhibitors (EP2-I and EP4-I) were added during stimulation of moDCs with indicated stimuli. (A–C) Left: representative flow cytometry plots are shown of intracellular staining of CD4+ T cells for IL-4 and IFN-γ. Numbers in plots represent frequencies of cells in indicated quadrants. Right: these data were used to calculate the fold change in frequency of IL-4+ and IFN-γ+ T cells polarized by moDCs stimulated with indicated stimuli relative to the cytokine production by T cells polarized by LPS-stimulated moDCs, for which the values were set to 1. Bars represent mean ± SEM of at least 4 independent experiments. Significance was calculated based on the ratio of IL-4 over IFN-γ between conditions. *P < 0.05 and **P < 0.01 for significantly different from control conditions based on paired analysis (paired Student t test). Underlying data can be found in S1 Data. ω-1, omega-1; CD4, cluster of differentiation 4; EP2, prostaglandin E2 receptor 2; IL-4, interleukin 4; IFNγ, interferon γ; LPS, lipopolysaccharide; moDC, monocyte-derived DC; PGE2, prostaglandin E2; SEA, soluble egg antigen; Th2, T helper 2.

