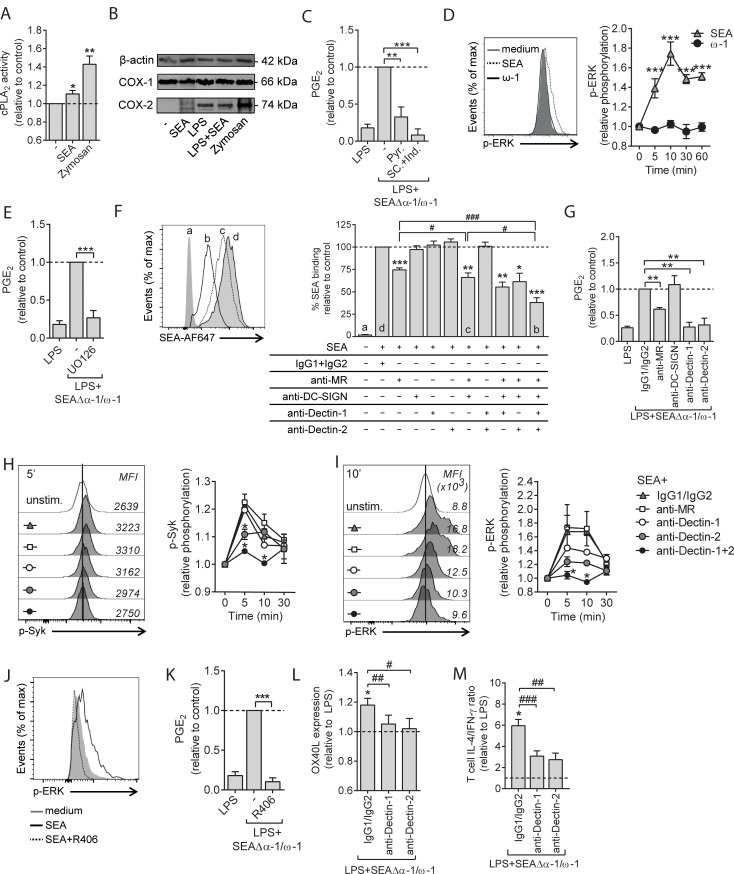
Fig 4. SEA promotes PGE2 synthesis and drives Th2 polarization via signaling through Dectin-1 and Dectin-2 in human moDCs.
(A) cPLA2 activity 8 h after stimulation. Zymosan was taken along as a positive control for cPLA2 activation. (B) Protein expression of COX-1 and COX-2 were assessed by western blot. β-actin was used as housekeeping protein. One of 3 experiments is shown. (C) Following 1 h pre-incubation with specific inhibitors for cPLA2 (Pyr.) or COX-1 and COX-2 (SC and ind., respectively), moDCs were stimulated for 12 h with LPS plus SEAΔα-1/ω-1, and supernatants were collected for PGE2 determination by LC-MS/MS. (D) At the indicated time points after stimulation with depicted stimuli, phosphorylation of ERK was determined by flow cytometry. A representative flow cytometry plot of intracellular staining for phospho-ERK is shown on the left. (E) PGE2 levels were determined as in panel C. U0216 was used as inhibitor of ERK. (F) moDCs were treated 45 min with indicated blocking antibodies or isotype controls after which the cells were incubated with PF-647–labeled SEA. Antigen binding/uptake was analyzed by flow cytometry and plotted as relative differences. A representative flow cytometry plot of SEA uptake is depicted on the left. (G) PGE2 levels were assessed as in panel C, following pre-incubation with blocking antibodies as described in panel F. (H) Syk and (I, J) ERK phosphorylation were determined as described in panel D following pre-incubation with blocking antibodies as described in panel F or panel J with Syk inhibitor R406. Representative flow cytometry plots of Syk (panel H) and ERK (panel I, J) phosphorylation is shown on the left. (K) PGE2 levels were assessed as in panel C. (L, M) moDCs were pre-incubated with indicated blocking antibodies, followed by 48 h stimulation with LPS plus SEAΔα-1/ω-1, after which OX40L expression was determined by flow cytometry. Data are based on geometric mean florescence. (M) Cells described in panel L were used for T-cell polarization assay as described in Fig 2A. Data represent mean ± SEM of 2 (panel D, H, I) or at least 3 independent experiments (panel A, C–G, J–M) and are shown relative to control conditions, which are set to 1 (panel A, C–E, G–M) or 100% (F). “*” and “#”: P < 0.05; “**” and “##”: P < 0.01; “***” and “###”: P < 0.001 for significant differences with the control (*) or between-test condition (#) based on paired analysis (paired Student t test). Underlying data can be found in S1 Data. COX, cyclooxygenase; cPLA2, cytosolic phospholipase A2; DC-SIGN, dendritic cell-specific intercellular adhesion molecule-3-grabbing non-integrin; ERK, extracellular signal-regulated kinase; ind., Indometacin; LC-MS/MS, liquid chromatography tandem mass spectrometry; LPS, lipopolysaccharide; moDC, monocyte-derived DC; MR, mannose receptor; OX40L, OX40 ligand; PGE2, prostaglandin E2; Pyr., Pyrrophenone; SC, SC236; SEA, soluble egg antigen; Syk, spleen tyrosine kinase; Th2, T helper 2.

