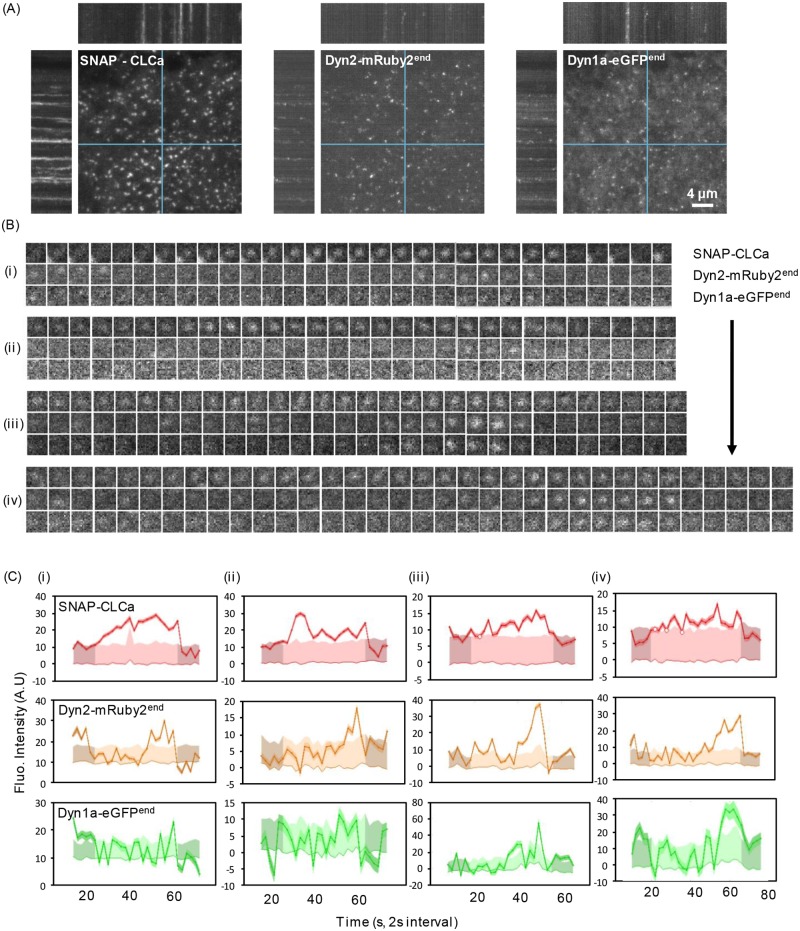
Fig 7. Tracking clathrin and dynamins in dual genome-edited Dyn1a-eGFP and Dyn2-mRuby2 A549 cells.
(A) Representative TIRF images and corresponding kymographs of dynamic behavior of overexpressed SNAP-CLCa, Dyn2-mRuby2end, and Dyn1a-eGFPend in dual genome-edited A549 cells. See S3 Movie. (B) Examples of Dyn1 and Dyn2 dynamics at individual CCPs (i–iv) and (C) their corresponding quantitative traces. CLCa, clathrin light chain a; Dyn1, dynamin-1.

