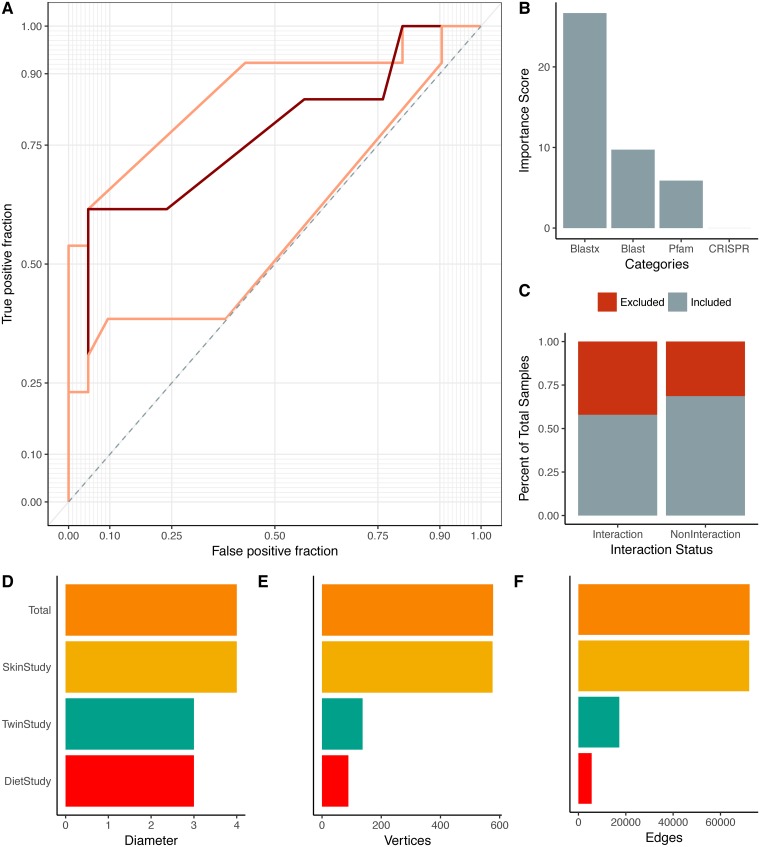
Fig 1. Summary of multi-study network model.
(A) Median ROC curve (dark red) used to create the microbiome-virome infection prediction model, based on nested cross validation over 25 random iterations. The maximum and minimum performance are shown in light red. (B) Importance scores associated with the metrics used in the random forest model to predict relationships between bacteria and phages. The importance score is defined as the mean decrease in accuracy of the model when a feature (e.g. Pfam) is excluded. Features include the local gene alignments between bacteria and phage genes (denoted blastx; the blastx algorithm in Diamond aligner), local genome nucleotide alignments between bacteria and phage OGUs, presence of experimentally validated protein family domains (Pfams) between phage and bacteria OGUs, and CRISPR targeting of bacteria toward phages (CRISPR). (C) Proportions of samples included (gray) and excluded (red) in the model. Samples were excluded from the model because they did not yield any scores. Those interactions without scores were automatically classified as not having interactions. (D) Network diameter (measure of graph size; the greatest number of traversed vertices required between two vertices), (E) number of vertices, and (F) number of edges (relationships) for the total network (orange) and the individual study sub-networks (diet study = red, skin study = yellow, twin study = green).

