Figure 6.
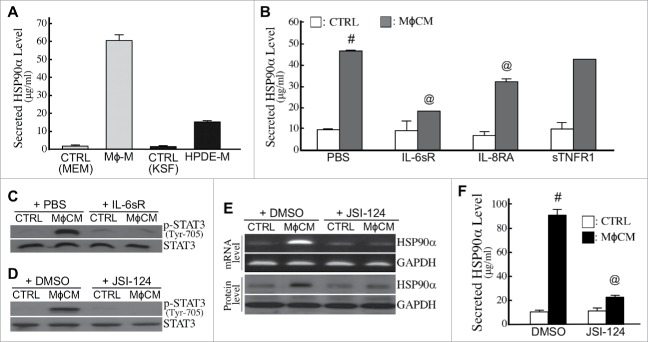
Expression and secretion of HSP90α from macrophages and macrophage-stimulated pancreatic ductal cells. (A) Secreted HSP90α levels in macrophage- and HPDE-culturing media (designated as Mϕ-M and HPDE-M, respectively) collected as described in Materials and Methods. The mean ± SD values of three independent experiments are shown. (B) HSP90α levels secreted from macrophage-conditioned HPDE cells. HPDE cells were treated 24 h with control medium (CTRL) or MϕCM in the absence or presence of 10 ng/ml IL-6sR, 0.5 μg/ml IL-8RA, or 50 ng/ml sTNFR1, and incubated with fresh KSF medium for another 24 h. Media were collected and assayed for secreted HSP90α levels as described in Methods. #, P < 0.05 when compared with the average HSP90α level secreted by CTRL-treated HPDE cells. @, P < 0.05 when compared with the average HSP90α level secreted from HPDE cells treated with MϕCM plus PBS or preimmune IgG. (C) Tyr-705-phosphorylated STAT3 and total STAT3 levels in HPDE cells treated 6 h with control medium (CTRL) or MϕCM in the absence or presence of 10 ng/ml IL-6sR. (D) Tyr-705-phosphorylated STAT3 and total STAT3 levels in HPDE cells treated 6 h with control medium (CTRL) or MϕCM in the absence or presence of 10 μM JSI-124. (E) mRNA and protein levels of HSP90α in HPDE cells treated 24 h with control medium (CTRL) or MϕCM in the absence or presence of 10 μM JSI-124. (F) HSP90α levels secreted from HPDE cells treated 24 h with control medium (CTRL) or MϕCM in the absence or presence of 10 μM JSI-124. #, P < 0.05 when compared with the data of CTRL treatment. @, P < 0.05 when compared with the data of control DMSO.

