Figure 8.
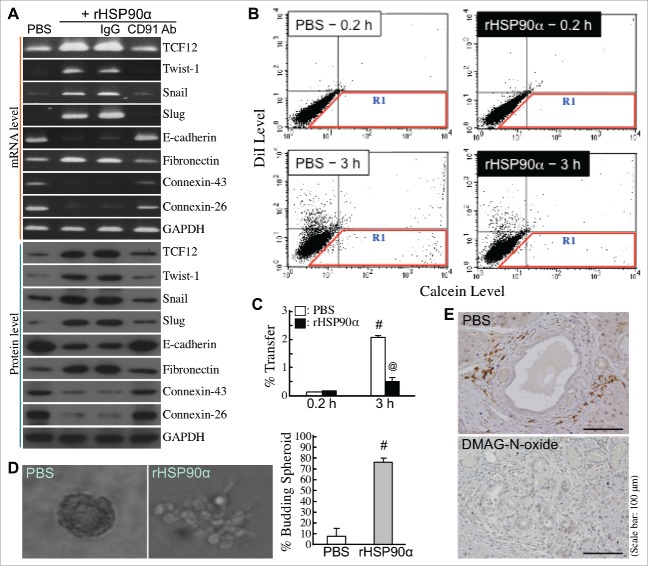
Induction of EMT by eHSP90α in pancreatic ductal epithelial cells. (A) mRNA and protein levels of TCF12, Twist-1, Snail, Slug, E-cadherin, fibronectin, connexin-26, connexin-43, and GAPDH in HPDE cells treated with PBS, 15 μg/ml rHSP90α, or 15 μg/ml rHSP90α plus control IgG or anti-CD91 antibody. (B,C) The Calcein-transfer assay was performed to evaluate gap-junction activity of HPDE cells treated 24 h with PBS or 15 μg/ml of rHSP90α. Treated HPDE cells were labeled with Calcein acetoxymethyl ester and DiI dyes and then added to a monolayer of unstained, untreated HPDE cells for 0.2 or 3-h co-culture. Finally, the monolayer of cells were trypsinized and analyzed by flow cytometry. Representative dot plots are shown in (B). The cells in the R1 region were categorized as Calcein-accepting cells. The ratio of Calcein-accepting cells (designated as “% Transfer”) was quantified by the CellQuest software, and mean ± SD values of three independent experiments have been provided to indicate that cellular gap-junction activity was significantly inhibited after rHSP90α treatment (C). #, P < 0.05 when compared with the data of PBS-treated cells at 0.2 h. @, P < 0.05 when compared with the data of PBS-treated cells at 3 h. (D) rHSP90α induced the invasive outgrowth of HPDE cells from 3-D spherical structures. HPDE cells were cultivated in 2% Matrigel-supplemented medium until the formation of spherical structures was observed. These cell spheroids were furthermore treated with 15 μg/ml rHSP90α for 72 h. Morphological changes were observed under an Olympus IX 71 inverted microscope. The left panel shows a typical cell spheroid and a budding, branching cell spheroid. The quantified data are shown in the right panel. #, P < 0.05 when compared with the data of PBS-treated cell spheroids. (E) Immunohistochemical analysis showing that TCF12-expressing pancreatic cells, located at the invasive front edges of hyperplastic lesions, were present in control but not in DMAG-N-oxide-treated LSL-KrasG12D/Pdx1-Cre mice.

