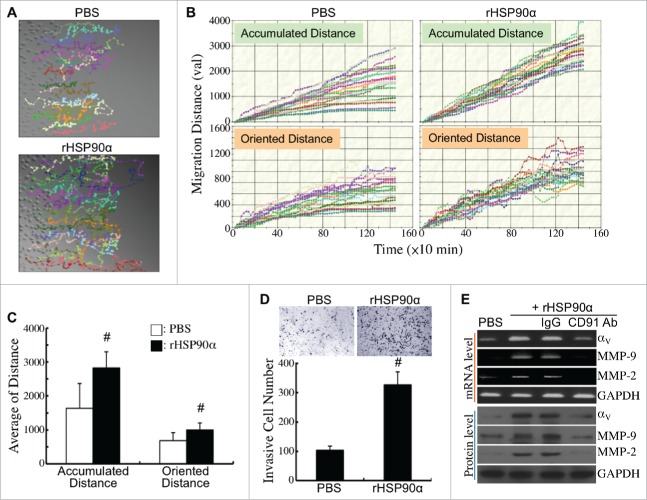
Figure 9.
Induction of HPDE cell migration and invasion by eHSP90α. (A) Cell migration tracks of HPDE cells treated with PBS or 15 μg/ml of rHSP90α. Cell migration was monitored for 24 h using time-lapse photography, and the movement tracks of twenty randomly selected PBS or rHSP90α-treated HPDE cells were analyzed by Image-Pro Plus software. (B) Quantification of the accumulated and oriented migration distances of the PBS or rHSP90α-treated HPDE cells selected in panel A. (C) Comparison of the average accumulated migration distances and oriented migration distances between the PBS and rHSP90α-treated HPDE cells. The data are expressed as mean ± SD values of three independent experiments. #, P < 0.05 when compared with the data of PBS-treated cells. (D) Transwell invasion assays of PBS or rHSP90α-treated HPDE cells. HPDE cells, incubated with or without 15 μg/ml of rHSP90α, were seeded in the top chambers of the Transwell inserts, and allowed to invade through the Matrigel for 16 h. Invasive cells on the filters of the Transwell inserts were counted by Image-Pro Plus software. The mean ± SD values of three independent experiments are shown. #, P < 0.05 when compared with the data of PBS-treated cells. (E) mRNA and protein levels of integrin αV, MMP-2, and MMP-9 in HPDE cells treated with PBS, 15 μg/ml rHSP90α, or 15 μg/ml rHSP90α plus control IgG or anti-CD91 antibody.

