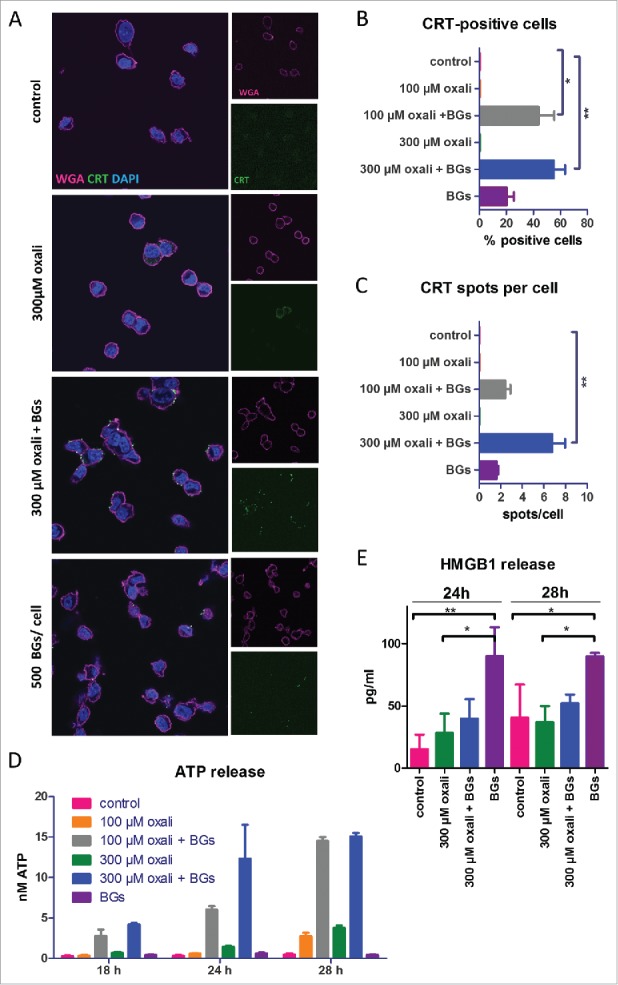
Figure 1.

Impact of BGs on the ICD hallmark induction of oxaliplatin in cell culture. (A) Immunofluorescent staining of CRT (green), membrane stain with wheat germ agglutinin (WGA, magenta) and DAPI nucleic stain of CT26 cells was performed after short term treatment (4 h) with oxaliplatin (oxali) and 500 BGs/cell. Representative confocal microphotographs at a magnification of 400x are shown. (B) Quantification of the cell number positive for CRT on the surface relative to the total number of cells, as well as (C) the amount of CRT spots per cell, was performed by counting. A minimum of 50 cells per treatment were counted. (D, E) CT26 cells were treated with the indicated agents and supernatants collected after the indicated incubation times. Subsequently, (D) ATP and (E) HMGB1 release was determined by a luminescent ATP detection assay or an ELISA kit, respectively. Data are represented as mean value ± S.D. of quadruplicates of one representative experiment. Statistical significance was calculated by one-way ANOVA and Bonferroni posttest * p < 0.05; **p < 0.01, significantly different from control.
