Figure 3.

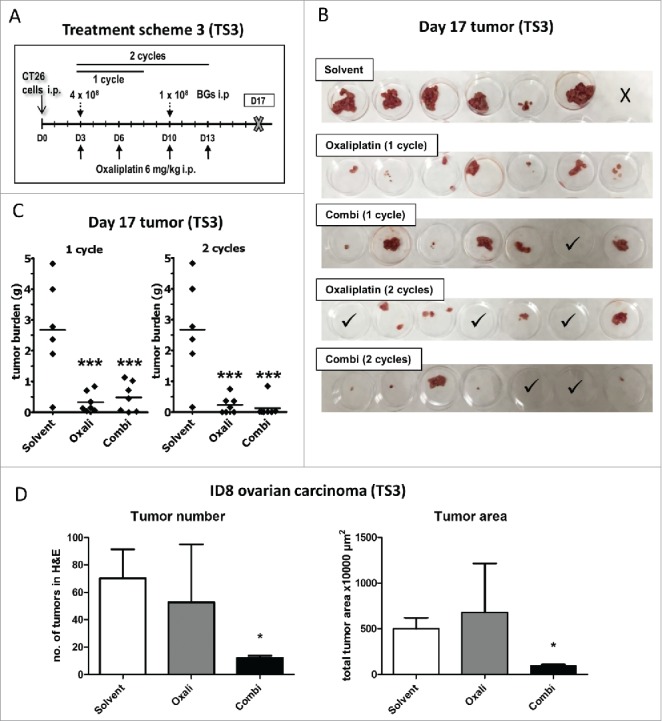
Enhanced efficacy of repeated combination treatment. (A) Female BALB/c mice were injected i.p. with 1 × 10⁵ CT26 cells on day 0 (D0) and treated according to TS3 (n = 7 per group). After one or two cycles of therapy, mice were dissected on day 17 and tumor weight assessed. (B) Pictures of the collected tumor tissues are shown (one of the solvent-treated animals died on day 16, thus no tumors were available here; ✓ marks tumor-free mice). (C) Individual and median tumor weights per treatment group are plotted. Statistical significance was calculated by nonparametric one-way ANOVA and Bonferroni posttest (***p < 0.001, as compared to solvent group). (D) Female C57 BL/6 mice were injected i.p. with 1 × 10⁶ ID8 cells and treated according to TS3 with two therapy cycles (n = 4 per group). The experiment was terminated on day 35 and the intraperitoneal fat tissue containing the small tumor lesions was collected, histologically reprocessed, and H&E-stained. Number of tumor nodules was evaluated from stained slides by counting. In addition, tumor area was digitally measured from scanned H&E-stained slides using Panoramic Viewer Software. Statistical significance was calculated by unpaired t test (* p < 0.05, as compared to solvent group).
