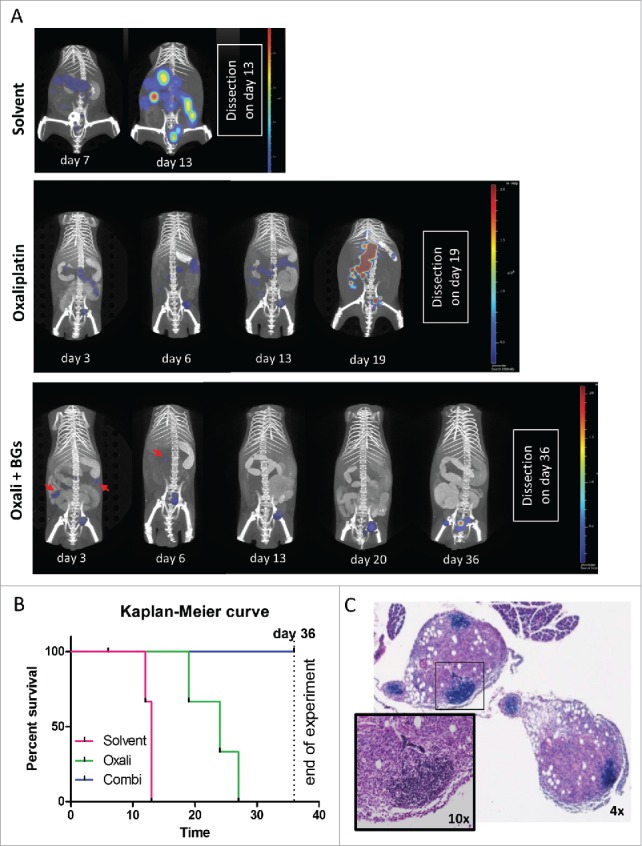
Figure 4.

Longitudinal evaluation of treatment response in vivo using CT26F-luc cells. Male BALB/c mice were injected i.p. with 1 × 10⁵ CT26F-luc cells on day 0 (D0) and treated according to TS2 (n = 3 per group). Following s.c. luciferin injection, DLIT/µCT was performed to evaluate tumor burden on the indicated days during treatment. (A) One representative animal is depicted for each treatment showing the overlay of the individual tumor nodules as 3D-luminescent signals (in photons per second) with the µCT scans (red arrows highlight tumor nodules responding to therapy). (B) OS of the treated mice is shown as a Kaplan Meier curve. Statistical significance was calculated by Log-rank test together with Cox Mantle posttest (* p < 0.05). Of note, the combination-treated animal #9 died during drug application on day 6. (C) Histological evaluation of tumor tissue collected from mouse #9 was done by H&E-stain. Infiltration of small, densely packed lymphocytes with a high nuclear/cytoplasmic ratio into two tumor nodules is shown (4x and 10x magnification).
