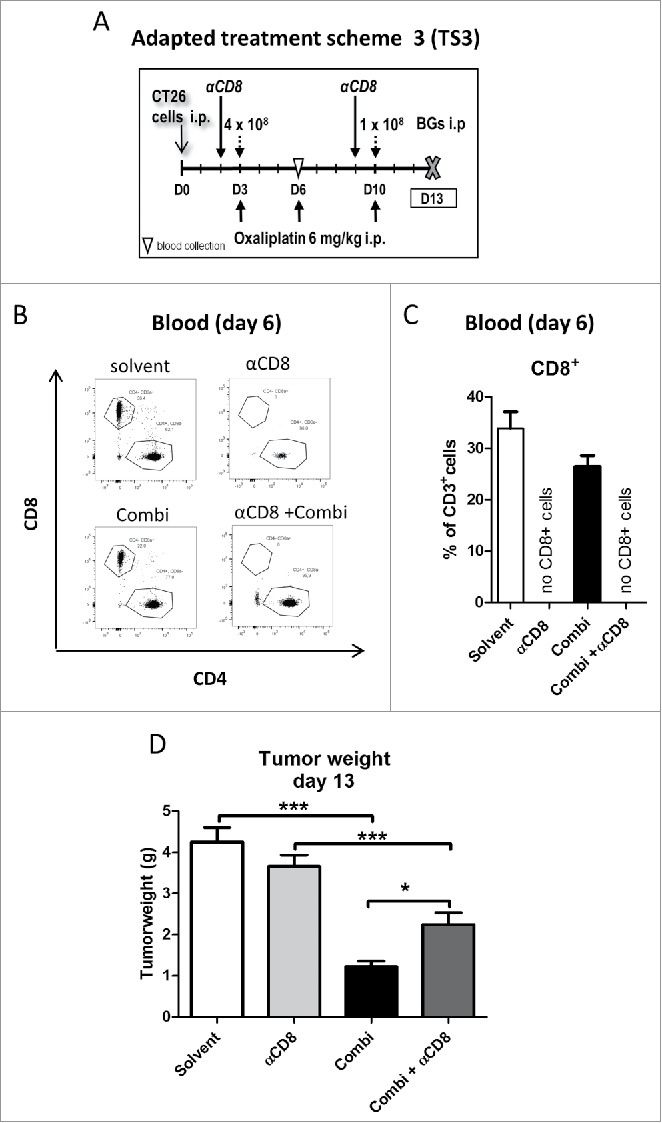
Figure 6.

Effect of CD8+ cells depletion on activity of combination treatment. (A) Male BALB/c mice were injected i.p. with 1 × 10⁵ CT26 cells on day 0 (D0) and treated according to the modified TS3 (n = 4 per group). Blood samples were taken on day 6 and mice were dissected on day 13. (B) Impact of treatment on cytotoxic T-cells (CD8+) was verified in blood samples, by flow cytometry. Representative dot plots and (C) quantification as fraction of CD8+ cells in CD3+ population are shown. (D) Tumor burden is plotted as mean ± SD. Statistical significance was calculated by unpaired t test (*p < 0.05;**p < 0.01;***p < 0.001)
