Figure 6.
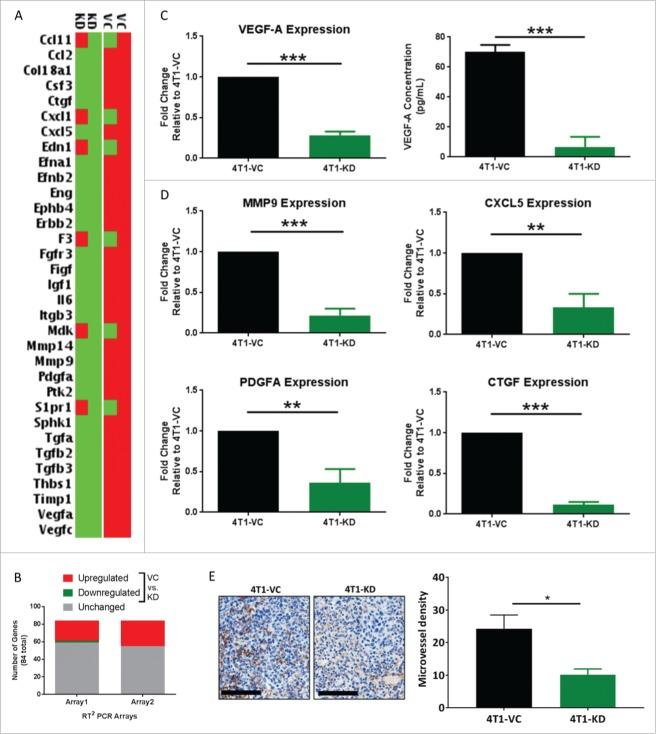
TSLP alters the tissue remodeling and angiogenesis pathways in AMs. AM/tumor co-cultures were utilized for all panels; strategy for the experimental design and RNA sample selection shown in Fig. 5A. (A) Heat-map of differential gene expression between AMs co-cultured with either 4T1-VC or 4T1-KD cells in two independent biologic experiments. Data shown highlight the genes most highly upregulated (red) or downregulated (green) (by 4.66-fold) for the two biologic replicates. (B) Data summarizes the number of differentially regulated genes (>2-fold, up or down) in 4T1-VC vs. 4T1-KD cells among the 84 total genes analyzed in this format. (C, left; D) Selected genes in A were validated by qRT-PCR analysis using the same RNA employed for the expression array. Data were normalized to the housekeeping gene GAPDH, and the 4T1-VC group set to 1.0 to determine relative expression of the 4T1-KD group. (C, right) VEGF-A protein levels as measured by ELISA. For data in C and D, the results represent the mean ± SEM of all replicates (n = 4/experiment or 8 total for the ELISA; n = 3–4/experiment or 6–8 total for the qRT-PCR) covering the two independent biologic experiments performed at different times. (E) The indicated tumor cell population was implanted orthotopically into mice (n = 3–5 per group), and the lungs were collected at endpoint for analysis by immunohistochemistry for CD31 expression. Left, Representative photomicrographs of CD31-immunostained metastatic lesions of mice bearing the indicated tumor cell population (20X magnification; scale bar represents 100-μm). Right, Quantification of microvessel density, as described in the Methods section. *P < 0.05; **P < 0.01; ***P < 0.001.

