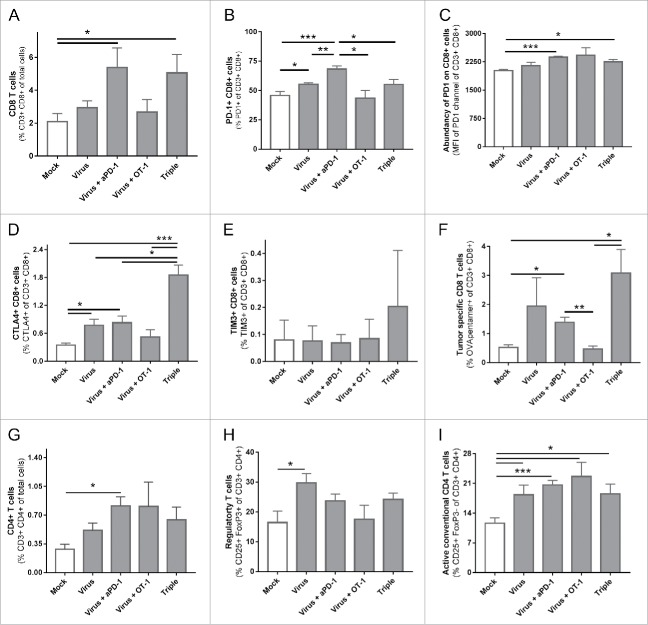
Figure 3.
Phenotypical analysis of tumor infiltrating lymphocytes 13 days after the different treatments started. (A) Percentage CD3+ CD8+ cells of total cells in the tumor. (B) Percentage of PD-1+ lymphocytes of parent population (CD3+ CD8+). (C) Mean fluorescence intensity of the channel used for anti-PD-1. (D) Percentage of CTLA-4+ lymphocytes of parent population (CD3+ CD8+). (E) Percentage of TIM-3+ lymphocytes of parent population (CD3+ CD8+). (F) Percentage of OVA-specific lymphocytes of parent population (CD3+ CD8+). (G) Percentage CD3+ CD4+ cells of total cells in the tumor. (H) Percentage of Regulatory T cells (CD25+ FoxP3+) of parent population (CD3+ CD4+).(I) Percentage of conventional CD4 T cells (CD25+ FoxP3-) of parent population (CD3+ CD4+).

