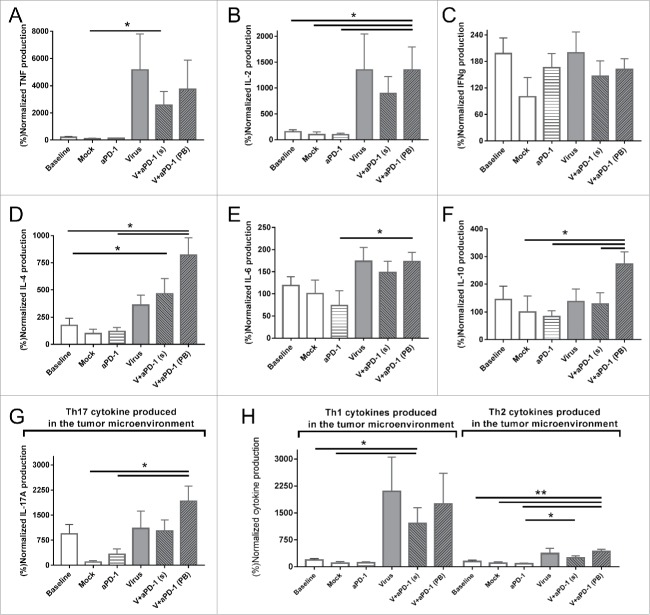
Figure 5.
Cytokine profile expression of tumor samples 11 days after the different treatments started. All values are normalized by the cytokine expression of the mock mean value (A) Tumor necrosis factor. (B) Interleukin-2. (C) Interferon gamma. (D) Interleukin-4. (E) Interleukin-6. (F) Interleukin-10. (G) Interleukin-17 A (also studied as Th17 signal representative cytokine). (H) Comparison of pooled Th1 (TNF, IL-2 and IFNg) and Th2 (IL-4, IL-6 and IL-10) cytokines present in the tumor microenvironment.

