
Figure 1.
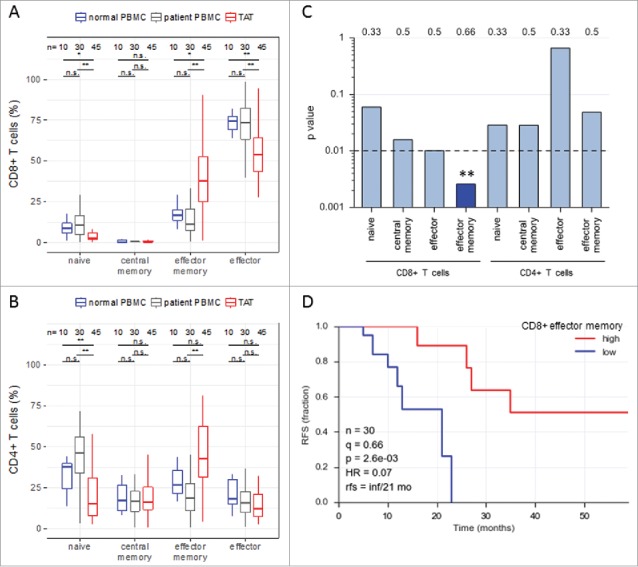
Abundance of subsets of CD8+ and CD4+ T cell subpopulations in human ovarian cancer ascites. (A) Flow cytometry analysis of CD8+ T cells from: blood of patients with benign disease (“normal blood”), blood of ovarian cancer patients (“patient blood”) and ascites of ovarian cancer patients (“ascites”). The gating for T cell subpopulations was performed based on the surface expression of CD45RA and CCR7 markers. Four T cell subpopulations were identified as follows: naïve (CD45RA+CCR7+), central memory (CD45RA−CCR7+), effector memory (CD45RA−CCR7−), effector (CD45RA+CCR7−). The gating strategy is shown in Figure S1, and pairwise correlations in Figure S2 (B) Analysis of CD4+ T cells subpopulations as in panel A. Statistical analysis was performed by unpaired t test (**: p < 0.01; ns: not significant). Samples sizes: normal blood, n = 10; patient blood, n = 41; ascites, n = 49). (C) Association of the different CD4 and CD8 T cell populations with ovarian cancer RFS (logrank test). Best fit p values are shown. Due to the relatively small sample size the significance threshold was set to 0.01 (dashed line; **: p < 0.01). Numbers at the top show the quantiles (0.33, 0.5, 0.66) yielding the most significant dichotomization of the samples (best fit). Dark blue: significant p value (< 0.01) and hazard ratio <1; light grey blue: p > 0.01. (D) Kaplan-Meier analysis of the association of abundance of CD8+ TEM (% CD45RA−CCR7−) with ovarian cancer RFS. Samples were dichotomized at the upper tercile (q = 0.66). p: logrank p-value; HR: hazard ratio; rfs: RFS for high versus low levels; inf: infinite (> 56 months).