
Figure 3.
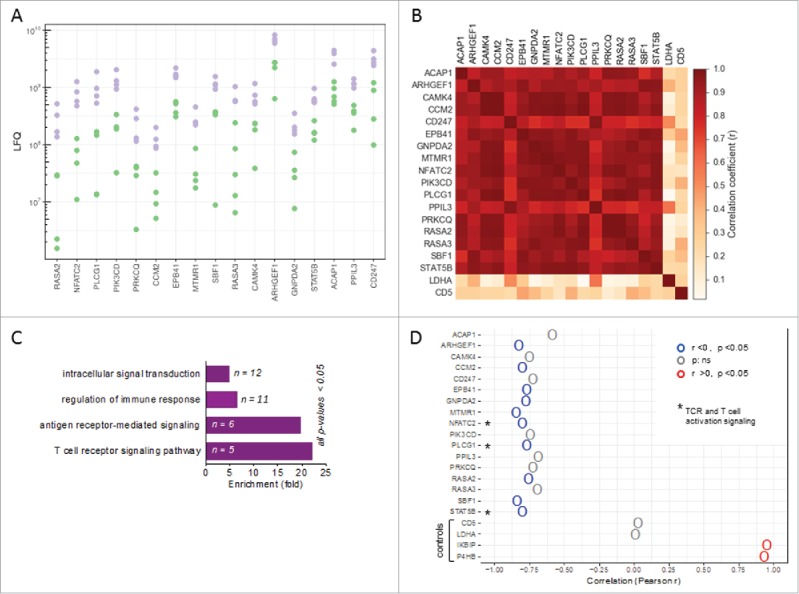
Patient-specific protein expression in TAT. (A) Proteins splitting ovarian cancer patients into high and low level expression groups (based on LFQ values in TAT determined by MS). Proteins with a > 2-fold difference between the maximum of the “low” group, depicted in green, and the minimum of the “high” group, depicted in purple, are displayed (descending order with the greatest difference on the left). (B) Heatmap showing the correlation (r-values) of expression (LFQ values) for the proteins in panel A. (C) PANTHER functional annotation (gene ontology enrichment analysis) of the proteins identified in panel A. n: number of genes in the respective group. List of the proteins is included in Figure S4. (D) Correlation (Pearson r) of the expression of these proteins in TAT with CD163 expression in TAM. High CD163 expression in TAM is a surrogate marker for a poor clinical outcome.32,37 Asterisks (*) indicate intracellular proteins associated with TCR signaling (“T cell receptor signaling pathway” in panel B). Lactate dehydrogenase A (LDHA) and CD5 served as controls for proteins showing a low fluctuation of expression. The IKBIP and the prolyl hydroxylase P4HB were included for comparison as proteins with a strong positive correlation with CD163 expression in TAM.