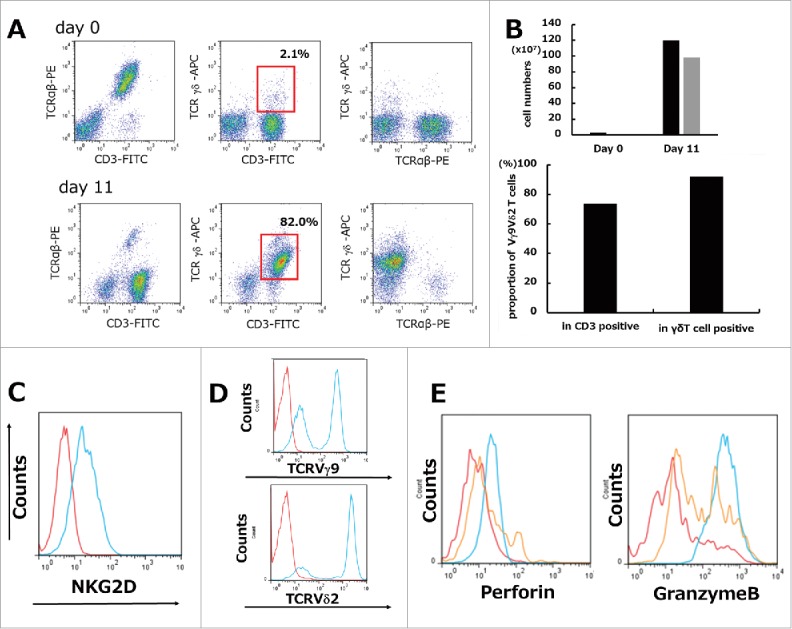
Figure 1.

Ex vivo mature human γδT cells were expanded from PBMCs stimulated by ZOL and rhIL2. (A) Representative data from healthy volunteer-derived γδT cells. Isolated PBMCs showed a minor subset of TCRγδ-positive (gated on lymphocytes by FSC/SSC) cells on day 0. Representative flow cytometric analysis showing the profiles of γδT cells in which >80% achieved a CD3+/TCRγδ+ population (red squares) on day 11. (B) The absolute cell number of γδT cells during 11 days of culture showed a maximum 1600-fold increase. Black bars: total cells; gray bars: γδT cells (upper graph). Proportion for Vγ9Vδ2 T cells among total T cells (CD3 positive cells) and total γδT cells (TCRγδ positive cells) was 73.6% and 92.0% respectively on day 11 (lower graph). (C) Expression of NKG2D on γδT cells. Representative flow cytometric profiles are shown as histograms. Blue line: expression of NKG2D on γδT cells (gated on TCRγδ+) on day 11; red line: background control. (D) Phenotypic analysis of γδT cells. Representative flow cytometric profiles are shown as histograms (gated on TCRγδ+). Lineage expressing Vγ9Vδ2 can be expanded by ZOL. Blue line: expression of TCRVγ9 or TCRVδ2 on γδT cells (gated on TCRγδ+) on day 11; red line: background control. (E) Intracellular granule (perforin, Granzyme B) staining was performed. Red line: day 0. Blue line: day 11. Orange line: PBMCs stimulated with Cell Stimulation cocktail 500X (2 μl/ml) were used as positive controls. Representative images of histograms are shown.
