Figure 6.

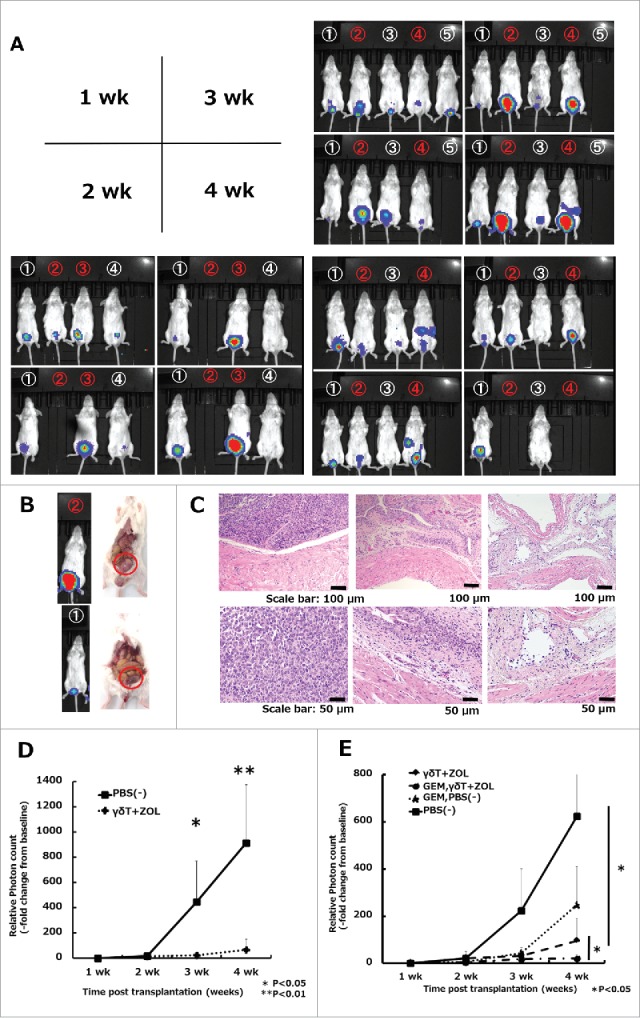
In vivo effects of Vγ9Vδ2 T cell weekly intravesical repeat treatment in combination with gemcitabine in an orthotopic mouse model. (A) Effects of weekly repeat treatment with γδT cells combined with 5 μM ZOL. Numbers in white denote γδT cell plus ZOL-treated mice, whereas numbers in red denote PBS-treated mice (vehicle control). The bioluminescense intensity of γδT cell plus ZOL-treated mice was markedly inhibited when compared with that in the vehicle-control arm, especially at 3 and 4 weeks. A blank space under the number indicates that the mice died during the analysis period. Representative images of three independent experiments are shown. (B) Representative laparotomy findings on day 30. Upper: PBS treatment; lower: γδT cell with 5 μM ZOL treatment. (C) Representative images of H&E-stained bladder sections on day 30. Left: PBS-treated mouse; middle: γδT cell-treated mouse; right: non-tumor transplanted mouse (control). Original magnification: × 10 (upper panels), × 20 (lower panels); scale bars: 100 μm (upper panels), 50 μm (lower panels). (D) Results of IVIS measurements. Experimental design is shown in Fig. 5B. Tumor growth was detected by cancer cell expressing luciferase signal (exposure: 3 min; binning: large) and bioluminescence intensity was quantified using the region of interest (ROI) tool. Results are expressed as the mean ± SEM (n = 6–7 per group). (E) Results of IVIS measurements in the four groups. The experimental design is shown in Fig. 5C. Tumor burden and bioluminescence intensity were most reduced in the ZOL and γδT cell in combination with the gemcitabine group when compared with the other groups. Weekly, repeated pretreatment with GEM (5 μM; dissolved in 200 μL PBS; four i.p. injections) synergistically enhanced the cytotoxicity of γδT cells when compared with the GEM untreated group in vivo with a statistically significant difference. Results are expressed as the mean ± SEM (n = 4–6 per group). Statistical significance is displayed as ** for P < 0.01 and * for P < 0.05.
