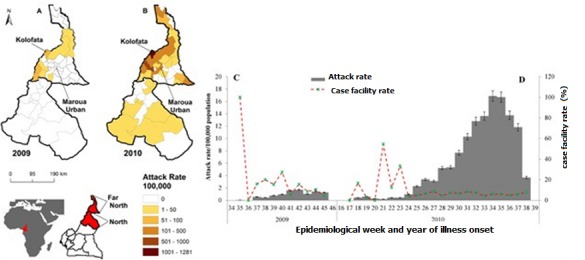
Figure 1.

Spatial (A and B) and temporal (C and D) distribution of cholera attack rate per 100,000 inhabitants in the North and Far North Regions, Cameroon, 2009-2010. In 2009, cholera was limited in the Far North (A) and (C); in 2010, it started in the North and spread to the Far North (B) and (D); the case fatality ratio (red dashed line of C and D) far exceeded 50% at the start of the epidemic in both years.
