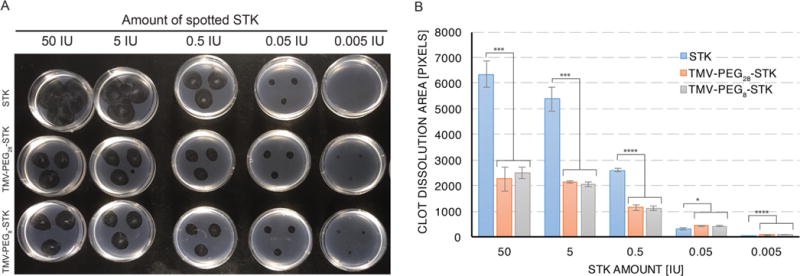
Figure 4.

Static in vitro assay of thrombolytic activity: phantom clot dissolution. (A) Image of phantom clots 20 h after application of STK and TMV-PEG8/28-STK solutions. The dark colored circular areas result from dissolution of fibrin clot by STK. Samples were applied in triplicates. (B) Area-of-dissolution analysis of image (A). Data were analyzed using Student’s t test (2-tailed, unpaired); statistically significant differences are indicated by ****p ≤ 0.0001, ***p ≤ 0.001, *p ≤ 0.05. No statistically significant differences were found between TMV-PEG8-STK and TMV-PEG28-STK samples of corresponding concentrations.
