
Figure 12.
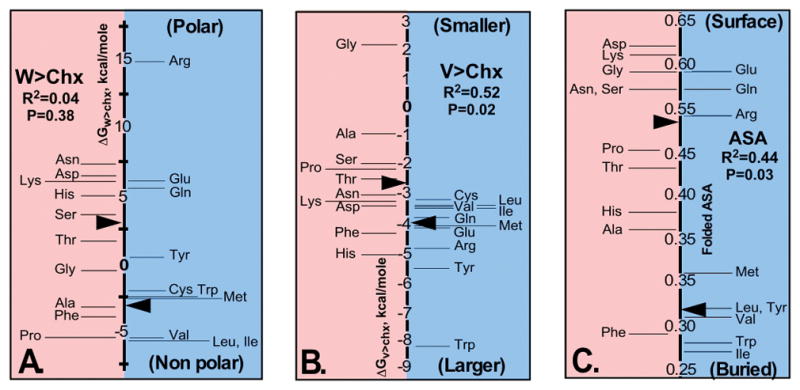
Comparisons of the phase transfer free energies of the Class I (blue) and II (red) amino acids. A. Water to cyclohexane transfer free energies, or hydrophobicity. B. Vapor to cyclohexane transfer free energies, which are closely related to side chain volume (R2 = 0.88). C. Exposed surface areas of amino acid side chains in folded proteins, estimated by Moelbert [130]. Median values are indicated by black arrow points. Statistics for regression models expressing each property as a function of amino acid Class are given below the titles. Extremes for each property are indicated at the top and bottom of the Class I half of each panel. (Adapted from Carter, CW Jr & Wolfenden, R. (2015) Proc. Nat. Acad. Sci. USA 24: 7489–7494.)