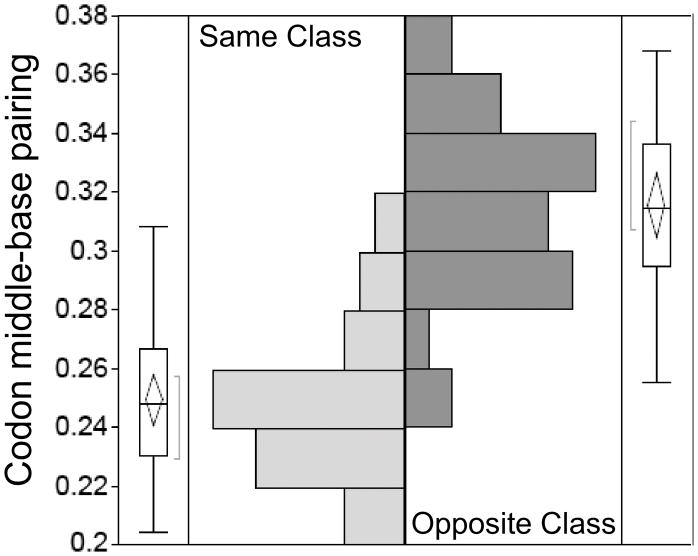
Figure 9.
Extended analysis of mean codon middle-base pairing. Results from [7] have been updated to include alignments of ~200 sequences from each of eleven contemporary synthetases (Asp, Asn, Glu, Gln, His, Ile, Leu, Pro, Phe, Trp, Tyr). Histograms are shown for the fraction of base pairing between middle codon bases for antisense alignments from the same and opposite aaRS Classes, as indicated. The difference between the two mean values indicated by horizontal lines in the logos outside the histograms is 0.067, which is ~14 times the standard error. Further statistics of the comparison are discussed in the text and shown in Fig. 10.

