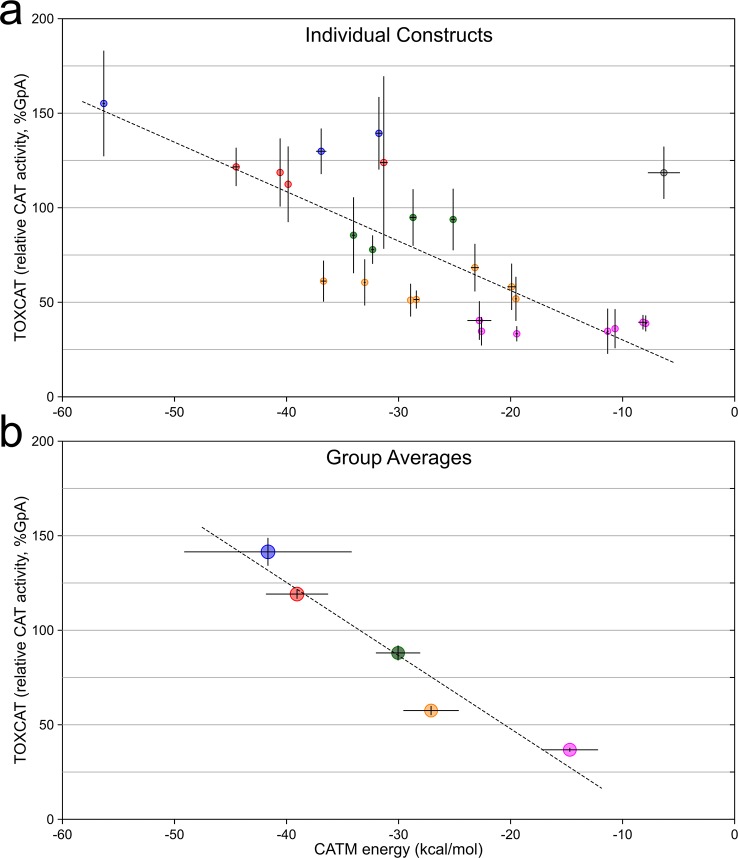
Figure 4.
Comparison of CATM energies with apparent TOXCAT dimerization. (a) Comparison of CATM energy score of 26 sequences and their TOXCAT signal (measured as the enzymatic activity of the reporter gene CAT). The points are color-coded according to the grouping in (b). The error bars represent the standard deviation among replicates. The dashed line represents the linear regression fit of the data, with the exclusion of the outlier point highlighted in gray (R2 = 0.647, p < 0.000005). (b) Same data as in (a), grouped and averaged in five bins based on CAT activity from weak (>25%, magenta) to very strong (>125%, blue), in 25% intervals. The error bars represent the standard error of the average. The dashed line is the linear regression of the data (R2 = 0.931, p < 0.01). The groups are the base of the analysis reported in Figure 5.

