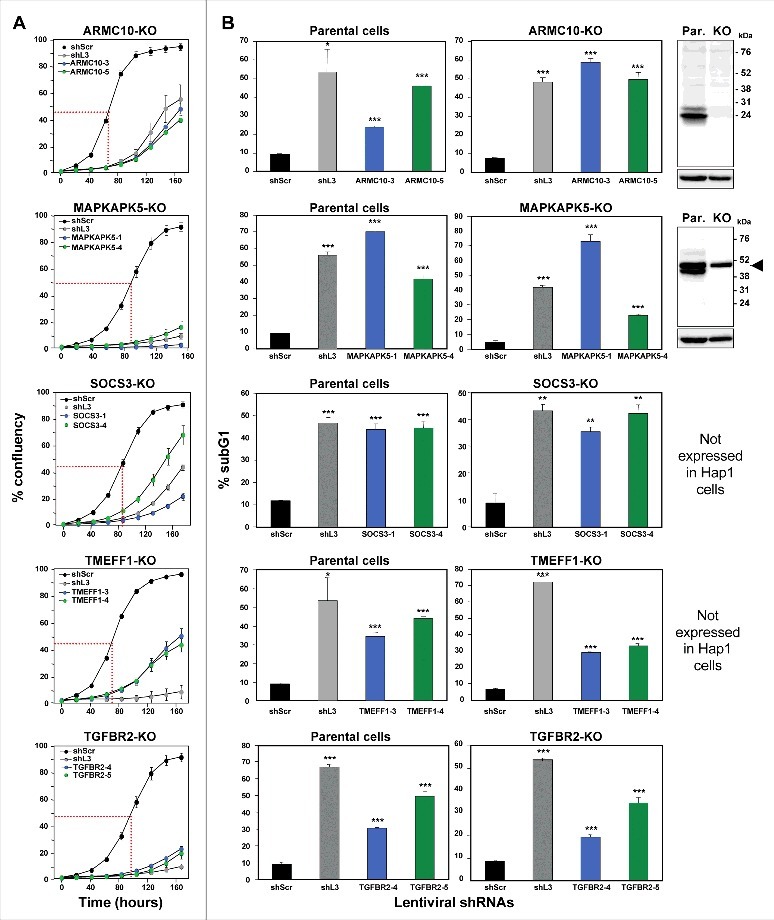
Figure 4.

shRNAs derived from four TS genes kill cells in the absence of the transcript and/or protein produced from the targeted gene.
Percent cell confluence over time (A) and percent nuclear PI staining (B) of HAP1 parental cells, or HAP1 knock-out cells, after infection with shScr, shL3, or one of two shRNAs each targeting the respective TS. Percent growth reduction values (as shown in Table 1) were calculated using STATA1C software when cells infected with shScr reached half maximal confluency as indicated by the red dotted line. p-values were calculated using a t-test. Western blot analyses in (B) confirm the knock-out of ARMC10 and MAPKAPK5 at the protein level. Arrowhead marks likely unspecific band. *p < 0.01, **p < 0.001, ***p < 0.0001. Color code for the two shRNAs per gene is the same as in Fig. 1.
